- Community
- IoT & Connectivity
- IoT & Connectivity Tips
- Descriptive Analytics
- Subscribe to RSS Feed
- Mark as New
- Mark as Read
- Bookmark
- Subscribe
- Printer Friendly Page
- Notify Moderator
Descriptive Analytics
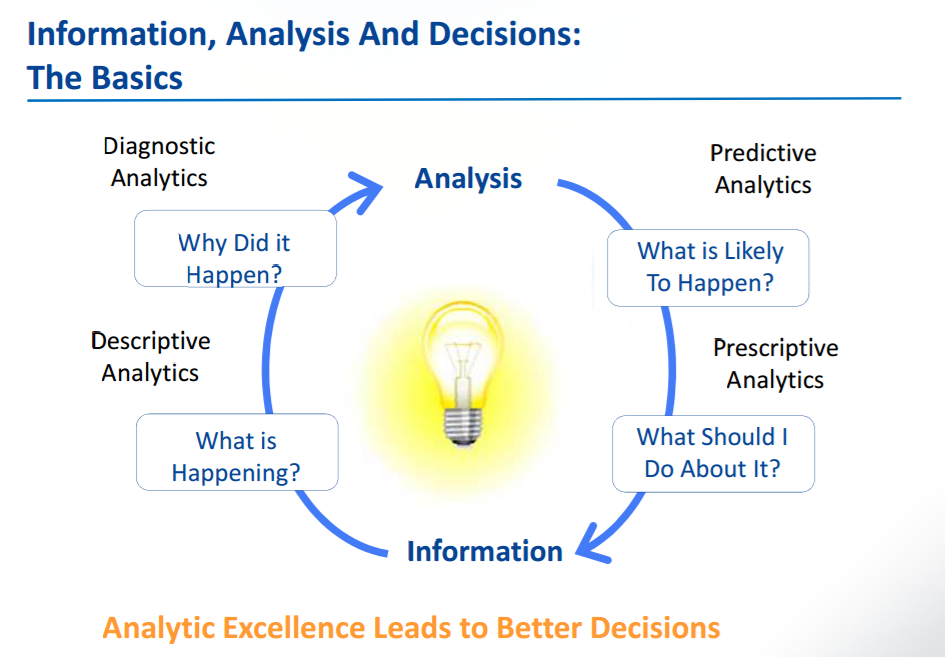
There are Four Types of Analytics:

Descriptive: What Happened?
Descriptive analytics is a preliminary stage of data processing that creates a summary of historical data to yield useful information and possibly prepare the data for further analysis. Analytics, which use data aggregation and data mining to provide insight into the past and answer: “What has happened?
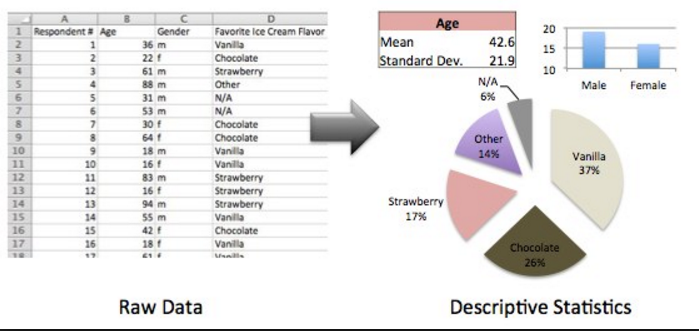
Descriptive analysis or statistics does exactly what the name implies they “Describe”, or summarize raw data and make it something that is interpret-able by humans. They are analytics that describe the past. The past refers to any point of time that an event has occurred, whether it is one minute ago, or one year ago. Descriptive analytics are useful because they allow us to learn from past behaviors, and understand how they might influence future outcomes.
The vast majority of the statistics we use fall into this category. (Think basic arithmetic like sums, averages, percent changes). Usually, the underlying data is a count, or aggregate of a filtered column of data to which basic math is applied. For all practical purposes, there are an infinite number of these statistics. Descriptive statistics are useful to show things like, total stock in inventory, average dollars spent per customer and Year over year change in sales. Common examples of descriptive analytics are reports that provide historical insights regarding the company’s production, financials, operations, sales, finance, inventory and customers.
Note: Use Descriptive Analytics when you need to understand at an aggregate level what is going on in your company, and when you want to summarize and describe different aspects of your business.

Different techniques of Descriptive Analytics:
- Sampling
- Mean
- Mode
- Median
- Standard Deviation
- Range and Variance
- Stem and Leaf Diagram
- Histogram
- Quartiles
- Frequency Distributions
Use of Descriptive Analytics in ThingWorx Analytics:
- Signal Detection: When analyzing volumes of data, it is helpful to know which data is actually useful and which data is just noise. Signals are based on a correlation algorithm that examines historical data to identify the strength of a given input in predicting future outcomes. Signals can identify meaningful correlations within the data. Signals are useful during initial analysis to determine which features you want to curate in a given data-set for predictive model generation. For example, knowing the month of the year is more important to accurately predicting tomorrow’s weather than knowing the day of the week. The month has a much stronger signal than the day of the week for this prediction. ThingWorx Analytics reports signal strength in a mutual information (MI) score that represents the probability of predicting the goal variable when a given feature is provided. It can effectively capture non-linear relationships. ThingWorx Analytics evaluates each feature, or combination of features, to identify the top signals.
- Cluster Analysis: Cluster analysis categorizes data into groups based on similarities relative to a goal variable. Like a clique, objects in a cluster minimize intra-distances (distances within the cluster) while maximizing inter-distances (distances between clusters). Clusters are mutually exclusive, meaning that each record can belong to only one cluster. However, ThingWorx Analytics supports a user-defined cluster hierarchy that can include sub-clusters inside other clusters. The higher the number of clusters in the data, the smaller each cluster’s population will be, but the stronger the potential insights can be.
How to Access Descriptive Analysis Functionality via ThingWorx Analytics:
- REST API Service — Using a REST client, you can access the Signals Service and the Clusters Service. Each service includes a series of API endpoints to submit analysis requests, retrieve results, list jobs, and more. Requires installation of the ThingWorx Analytics Server.
- Analytics Builder — As part of the ThingWorx Analytics Extension, Analytics Builder provides a user interface for interacting with your data. In addition to generating and scoring predictive models in Analytics Builder, you can also run procedures to generate signals.
How to avoid mistakes - Useful tips for Different Techniques of Descriptive Analytics:
- Crystallize the research problem → Operability of it!
- Read literature on data analysis techniques.
- Evaluate various techniques that can do similar things w.r.t. to research problem.
- Know what a technique does and what it doesn’t.
- Consult people, esp. supervisor.
- Mark as Read
- Mark as New
- Bookmark
- Permalink
- Notify Moderator
So, what is the difference then between Cluster Analysis and Profiles, where you also create groups related to the goal?
- Mark as Read
- Mark as New
- Bookmark
- Permalink
- Notify Moderator
What is Formula definition of mi of Thingworx Analytics?
Is this normalization?
Are there documents can refer?
- Mark as Read
- Mark as New
- Bookmark
- Permalink
- Notify Moderator
You could follow the below Article.
This article contains different techniques which are behind ThingWorx Analytics. We can not add our custom code or algorithms.
Regards-Mohit
- Mark as Read
- Mark as New
- Bookmark
- Permalink
- Notify Moderator

