Community Tip - Need to share some code when posting a question or reply? Make sure to use the "Insert code sample" menu option. Learn more! X
- Subscribe to RSS Feed
- Mark Topic as New
- Mark Topic as Read
- Float this Topic for Current User
- Bookmark
- Subscribe
- Mute
- Printer Friendly Page
Modeling of SAW Delay Lines
- Mark as New
- Bookmark
- Subscribe
- Mute
- Subscribe to RSS Feed
- Permalink
- Notify Moderator
Modeling of SAW Delay Lines
By W.C. Wilson and G.M. Atkinson

Using PTC Mathcad to Model and Solve
PLEASE NOTE: At the request of the original file creator the attachements to this document have been removed, the text provided is meant to provide an archive for members who have previously bookmarked this resource.
About this worksheet:
- Demonstrates how NASA engineers use PTC Mathcad to model SAW (Surface Acoustic Wave) sensors to be used for Integrated Vehicle Health Monitoring in aerospace vehicles
- Relevant for sensor design in aerospace and defense, electronics, hight tech, industrial applications, and automotive applications
- Allows users to implement clear, understandable mathematical models and transfer functions
This worksheet using PTC Mathcad shows how you can use Mathcad to model SAW sensors in aerospace vehicles. The lack of support for transcendentals within the Differential Algebraic Equation framework prevents the use of the frequency domain analysis in analog extended Hardware Description Languages (HDLs). Although frequency domain analysis exists in VHDL-AMS it is rudimentary and is not sufficient for some general frequency domain modeling, that is why NASA chose to use Mathcad. These functions are constructed with the help of PTC Mathcad's standard function library which includes:
- Trigonometric functions
- piece-wise continuous functions
- logarithmic functions
- user defined functions
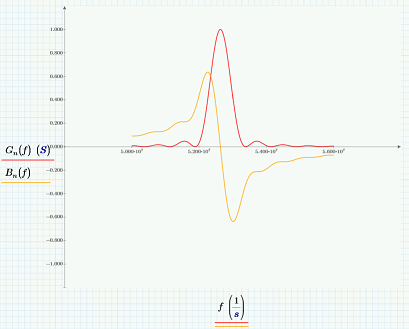
The Impulse Response method was used to model the SAW delay line. This is a first order model and it models the piezoelectric, mechanical and electrical behaviors of the SAW device. The Impulse Response method uses the Mason equivalent circuit. For each IDT the model is comprised of the radiation conductance, the acoustic susceptance, and the total capacitance CT. 2D plots of the frequency response, radiation conductance, and the acoustic susceptance of the example design allow complete analysis of the SAW device .
2D plots are used to show the measured and calculated frequency response to verify requirements have been met. This worksheet provides you with a very in-depth example of how you can use Mathcad to model. Graphs, plots, images, notation, inputs, and solutions are all included to aid you.
Download and explore this worksheet yourself! You can download a free lifetime copy of PTC Mathcad Express and get 30 days of full functionality.
- Mark as New
- Bookmark
- Subscribe
- Mute
- Subscribe to RSS Feed
- Permalink
- Notify Moderator
Where's the worksheet?
- Mark as New
- Bookmark
- Subscribe
- Mute
- Subscribe to RSS Feed
- Permalink
- Notify Moderator
Removed - but some info here
https://ntrs.nasa.gov/api/citations/20070016024/downloads/20070016024.pdf
- Mark as New
- Bookmark
- Subscribe
- Mute
- Subscribe to RSS Feed
- Permalink
- Notify Moderator
PDF "1 st Order Modeling of a SAW Delay Line using MathCAD".
- Mark as New
- Bookmark
- Subscribe
- Mute
- Subscribe to RSS Feed
- Permalink
- Notify Moderator
Thank you.


