Community Tip - You can subscribe to a forum, label or individual post and receive email notifications when someone posts a new topic or reply. Learn more! X
- Community
- Creo+ and Creo Parametric
- Analysis
- Non-linear material properties in Creo Simulate?
- Subscribe to RSS Feed
- Mark Topic as New
- Mark Topic as Read
- Float this Topic for Current User
- Bookmark
- Subscribe
- Mute
- Printer Friendly Page
Non-linear material properties in Creo Simulate?
- Mark as New
- Bookmark
- Subscribe
- Mute
- Subscribe to RSS Feed
- Permalink
- Notify Moderator
Non-linear material properties in Creo Simulate?
Hello,
I have been using Creo Simulate 2.0 for a few months for linear static structural analysis of plastic parts.
Now I want to move on to non-linear analysis.
I am facing difficulties in understanding how Creo Simulate sets the non-linear material properties.
The plastic I am using is brittle in nature.
Following are the engineering values available from the vendor's material data sheet:
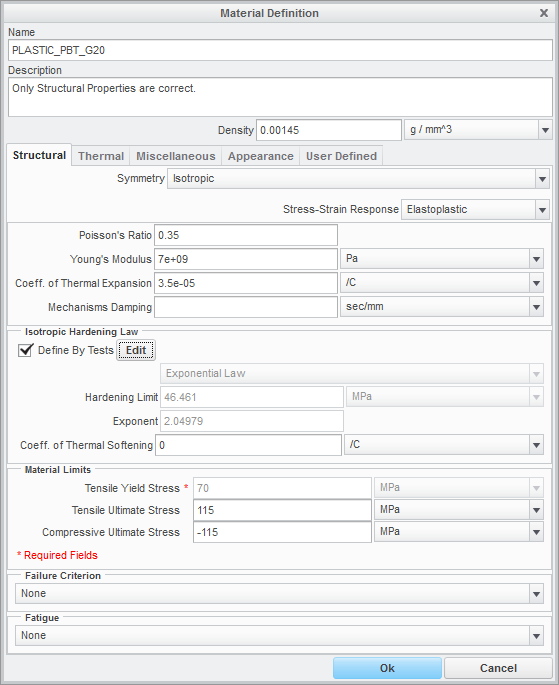
Young's Modulus = 7GPa
Stress at break = 115MPa
Strain at break = 2.6%
Flexural strength = 176MPa (Where do I put this value?)
Yield Strength is not available. So assuming = 70MPa
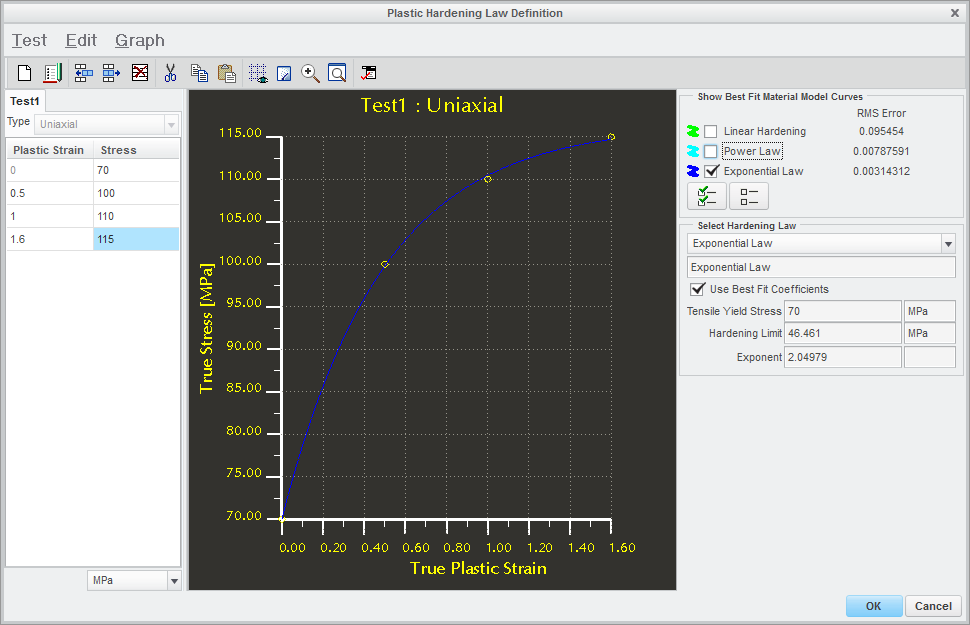
Here is what I put in Creo Simulate:


I have some questions:
1. Whatever I have done, is that right?
2. How do I see the entire stress strain curve for the material?
3. Does Simulate maintain tangency between the linear and non-linear curves?
4. Is there any significant difference in computation time between the 3 types of curves?
5. Does Simulate use the Yield Strength value for any type of simulation? In the sense that if I take the Yield strength value much lower than it is but maintain the same stress-strain curve, will it affect the results anyhow?
This thread is inactive and closed by the PTC Community Management Team. If you would like to provide a reply and re-open this thread, please notify the moderator and reference the thread. You may also use "Start a topic" button to ask a new question. Please be sure to include what version of the PTC product you are using so another community member knowledgeable about your version may be able to assist.
Solved! Go to Solution.
Accepted Solutions
- Mark as New
- Bookmark
- Subscribe
- Mute
- Subscribe to RSS Feed
- Permalink
- Notify Moderator
@Giulio cannot upload any data due to company policy...
@Shaun the same file is shown during the diagnostics and sometimes gives helpful information.
But in this case it does not.
It seems that I have solved the problem.
The strain values I had entered (see graph in question) were in %. Simulate expects these in absolute terms. This solved the problem.
I strongly feel Simulate should give some hints for which units are to be used for corresponding type of analysis.
- Mark as New
- Bookmark
- Subscribe
- Mute
- Subscribe to RSS Feed
- Permalink
- Notify Moderator
- Mark as New
- Bookmark
- Subscribe
- Mute
- Subscribe to RSS Feed
- Permalink
- Notify Moderator
Thank you for sharing that document!
But my questions still remain unanswered...
- Mark as New
- Bookmark
- Subscribe
- Mute
- Subscribe to RSS Feed
- Permalink
- Notify Moderator
1. Whatever I have done, is that right?
2. How do I see the entire stress strain curve for the material?
You see only the part of true stress-strain curve after the linear behavior.
3. Does Simulate maintain tangency between the linear and non-linear curves?
I really think yes.
4. Is there any significant difference in computation time between the 3 types of curves?
If the stresses are low and the material remains in linear behavior, I think the time don't change.
Otherwise you go into plastic behavior and the displacements became considerable, so you have to do a non-linear static analysis and here you are who choose the time step. The convergence time for each step is function of the mesh, the contact surfaces if there are, the gradient of the displacement...
Personally I don't think it is a problem the difference of time.
5. Does Simulate use the Yield Strength value for any type of simulation? In the sense that if I take the Yield strength value much lower than it is but maintain the same stress-strain curve, will it affect the results anyhow?
That value that you insert in the material tab serves only if you select a failure method, so the program can tell you if the component is broken or not and where.
- Mark as New
- Bookmark
- Subscribe
- Mute
- Subscribe to RSS Feed
- Permalink
- Notify Moderator
1. Now, I understand when to use engineering values and when to use true values.
2 and 3. It would really be helpful to know the entire stress-strain curve (can be used in PPT's too ![]() ). Maybe someone from PTC can better answer this.
). Maybe someone from PTC can better answer this.
4. For a particular part, the solution could never converge irrespective of how many small time steps I took. I even made the mesh finer where I suspected there would be large strains. However until now the solution fails to converge at pass 2 for the last time step. It would be really helpful to know why the solution is unable to converge and for which elements.
5. Can I get some document to better understand this?
- Mark as New
- Bookmark
- Subscribe
- Mute
- Subscribe to RSS Feed
- Permalink
- Notify Moderator
Please, upload your model so we can better observe the situation you're talking.
- Mark as New
- Bookmark
- Subscribe
- Mute
- Subscribe to RSS Feed
- Permalink
- Notify Moderator
For a particular part, the solution could never converge irrespective of how many small time steps I took. I even made the mesh finer where I suspected there would be large strains. However until now the solution fails to converge at pass 2 for the last time step. It would be really helpful to know why the solution is unable to converge and for which elements.
Look in the .PAS file; are there any warning about a decomposing a singular stiffness matrix?
- Mark as New
- Bookmark
- Subscribe
- Mute
- Subscribe to RSS Feed
- Permalink
- Notify Moderator
@Giulio cannot upload any data due to company policy...
@Shaun the same file is shown during the diagnostics and sometimes gives helpful information.
But in this case it does not.
It seems that I have solved the problem.
The strain values I had entered (see graph in question) were in %. Simulate expects these in absolute terms. This solved the problem.
I strongly feel Simulate should give some hints for which units are to be used for corresponding type of analysis.


