- Community
- Creo+ and Creo Parametric
- Customization
- Re: Creo Simulate Bimetal Beam Problem
- Subscribe to RSS Feed
- Mark Topic as New
- Mark Topic as Read
- Float this Topic for Current User
- Bookmark
- Subscribe
- Mute
- Printer Friendly Page
Creo Simulate Bimetal Beam Problem
- Mark as New
- Bookmark
- Subscribe
- Mute
- Subscribe to RSS Feed
- Permalink
- Notify Moderator
Creo Simulate Bimetal Beam Problem
Hello,
I’m pretty new to Creo and Creo Simulate, and I’m using Creo Simulate to look at the stress distribution in a bimetal rectangular beam.
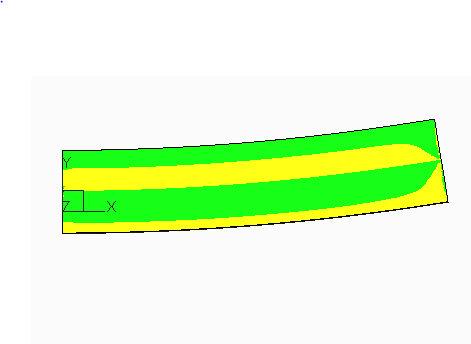
The bottom half of the beam is aluminum, and the top half is steel. The halves are bonded together. The entire beam is heated from 20 degrees C to 200 degrees C. The left side of the beam is fixed in the X direction.
This results window shows the XX stress in the beam. The green regions are negative (compression) and the yellow regions are positive (tension).
Front view of beam:

if you start at the left and move along the x axis, the stress distribution looks fairly uniform until you get to the end of the beam, where it changes a bit.
If you rotate the beam to look at its right side:

Here the stress distribution looks “blotchy.”
Should I expect the stress in the beam to be uniform throughout? Or is it normal that the stress gets complicated at the end of the beam, on the right side?
Thank you!
Steven
This thread is inactive and closed by the PTC Community Management Team. If you would like to provide a reply and re-open this thread, please notify the moderator and reference the thread. You may also use "Start a topic" button to ask a new question. Please be sure to include what version of the PTC product you are using so another community member knowledgeable about your version may be able to assist.
- Labels:
-
General
- Mark as New
- Bookmark
- Subscribe
- Mute
- Subscribe to RSS Feed
- Permalink
- Notify Moderator
Interesting results ![]()
It makes sense, though i don't think i could have predicted this.
Alu expands more than steel, but they are connected. At the interface there will be an equilibrium in displacements. The steel is holding back the alu from expanding on that side, while the alu helps the steel expand more on that side. If you cut the system into two separate beams, one of alu and one of steel, you now have a case of a beam fully constrained on the left side, and with a distributed load in axial direction on one side of the beam. Each beam will curve, and so each of the beams will have a neutral line, a compressive stress side and a tensile stress side. So that explains the striped flag effect.
At the unconstrained end of the beam, there can be no stress in axial direction, because the material ends in air, and air is not a very stiff medium. So the axial stress at the free end must be zero. That is your "blotchy" stress distribution. I'm sure the stress values there are all near-zero.
Remains the transition from the flag to zero. That is not so easy to explain. But since FEA did so well in the other bits, I trust that this is actually what the transition looks like. Very interesting!
- Mark as New
- Bookmark
- Subscribe
- Mute
- Subscribe to RSS Feed
- Permalink
- Notify Moderator
Hi Patrick,
Good job explaining the situation- I think your explanation helped me to better understand what's going on. When I look at the stress values at the surface of the free end, most of them are very close to zero, which makes sense. Thanks for your response!
- Mark as New
- Bookmark
- Subscribe
- Mute
- Subscribe to RSS Feed
- Permalink
- Notify Moderator
It looks as if you have 2 colours in the stress plot legend. If the stress level is even and at/near a colour interface some areas will be one colour, other will have another colour. If you change the legend's max/min's so that it goes from min to max for the "blotchy" area, it might not look so blotchy anymore.
- Mark as New
- Bookmark
- Subscribe
- Mute
- Subscribe to RSS Feed
- Permalink
- Notify Moderator
Hi Mats,
You are correct- at the color interface between green and yellow the stress value is 0, and for most of the free end surface, the stress is very close to 0. So that's what causes the blotchiness. When I edit legend values, that gets rid of the blotchiness. Thanks for your response!


