
Turn on suggestions
Auto-suggest helps you quickly narrow down your search results by suggesting possible matches as you type.
Showing results for
Turn on suggestions
Auto-suggest helps you quickly narrow down your search results by suggesting possible matches as you type.
Showing results for
Community Tip - Did you get called away in the middle of writing a post? Don't worry you can find your unfinished post later in the Drafts section of your profile page. X
- Community
- Creo+ and Creo Parametric
- 3D Part & Assembly Design
- Mechanica results variability
Options
- Subscribe to RSS Feed
- Mark Topic as New
- Mark Topic as Read
- Float this Topic for Current User
- Bookmark
- Subscribe
- Mute
- Printer Friendly Page
Mechanica results variability
Nov 14, 2011
05:49 AM
- Mark as New
- Bookmark
- Subscribe
- Mute
- Subscribe to RSS Feed
- Permalink
- Notify Moderator
Nov 14, 2011
05:49 AM
Mechanica results variability
I've just run a Mechanica sensitivity study (linear static, using Single Pass Adaptive, remesh and repeat P-loop each iteration) and got the following result:
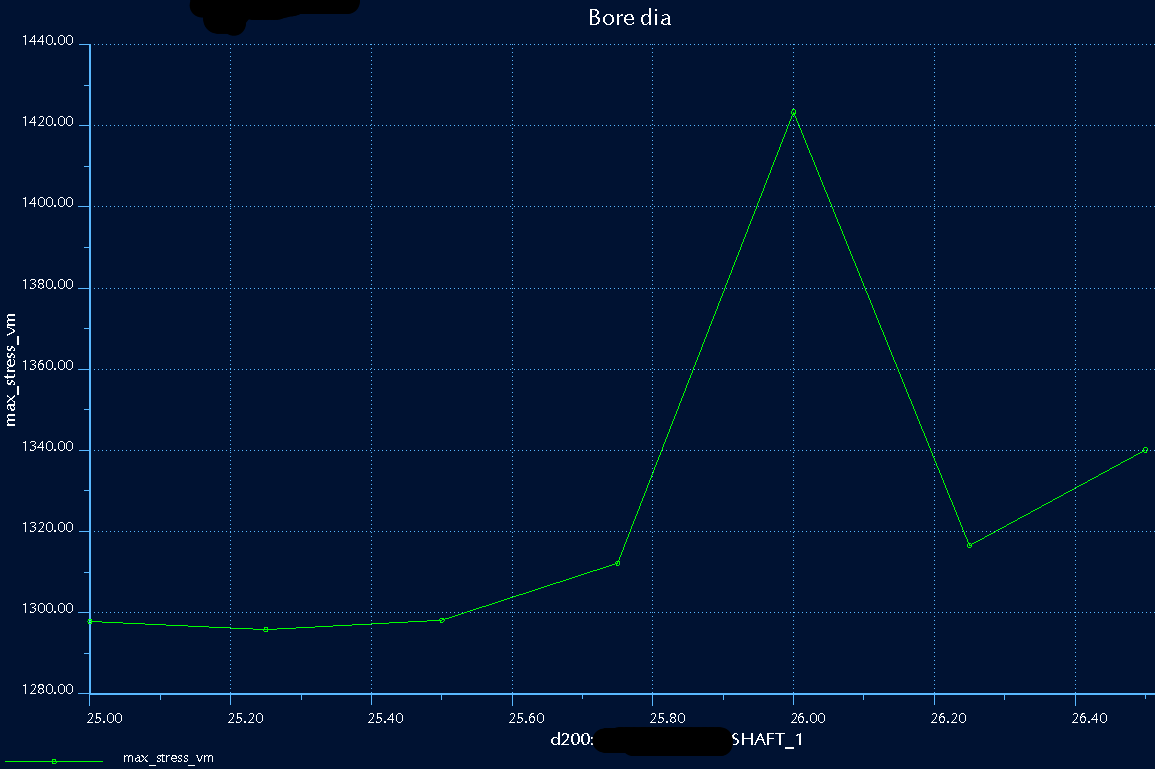
(If this isn't legible, the lower end of the curve shows just under 1300 MPa at a dimension value of 25, increasing to 1340 at 26.5 but with a spike of 1420 at 26.0.)
I've used mesh controls to apply a pretty fine mesh, and geometrically there's no reason for any odd results at that particular point (I'm varying the bore of a shaft with OD 42, and max stress is on a chamfered radial Ø3 hole through this portion of the shaft).
More strangely, I then set the dimension to 26 and ran a single static analysis - and found a max_stress_vm of 1321 MPa, which fits the curve pretty much perfectly and disagrees with that high data point.
This spike is a variation of 7-9% on the 'basic' stress which seems like a very large error margin - what gives? I've tried Multi Pass Adaptive in the past, but I've found that without mesh controls it doesn't necessarily converge well, so I generally just use SPA and use my judgement to add mesh controls where needed. As you can see, six of my seven data points do follow a smooth curve using this technique.
This thread is inactive and closed by the PTC Community Management Team. If you would like to provide a reply and re-open this thread, please notify the moderator and reference the thread. You may also use "Start a topic" button to ask a new question. Please be sure to include what version of the PTC product you are using so another community member knowledgeable about your version may be able to assist.
Labels:
- Labels:
-
2D Drawing
15 REPLIES 15
Nov 17, 2011
08:07 PM
- Mark as New
- Bookmark
- Subscribe
- Mute
- Subscribe to RSS Feed
- Permalink
- Notify Moderator
Nov 17, 2011
08:07 PM
Hi Jonathan:
Please contact PTC technical support and file an issue so that we can take a look at this problem.
Thanks
Eduardo
Nov 18, 2011
03:51 AM
- Mark as New
- Bookmark
- Subscribe
- Mute
- Subscribe to RSS Feed
- Permalink
- Notify Moderator
Nov 18, 2011
03:51 AM
Hi Eduardo,
Unfortunately I did not save that particular analysis.
The part has changed since then, and I do not have a record of the exact combination of parameters which gave this result.
I will bear this in mind for future analyses.
Thanks,
Jonathan
Apr 26, 2012
06:29 AM
- Mark as New
- Bookmark
- Subscribe
- Mute
- Subscribe to RSS Feed
- Permalink
- Notify Moderator
Apr 26, 2012
06:29 AM
Okay, it's done it again.
I've zipped up the result sets (thereby including the models) and have opened Case 10789069.
May 02, 2012
09:59 AM
- Mark as New
- Bookmark
- Subscribe
- Mute
- Subscribe to RSS Feed
- Permalink
- Notify Moderator
May 02, 2012
09:59 AM
Another instance of this. I've uploaded more files to the case above.
Aug 22, 2012
10:10 AM
- Mark as New
- Bookmark
- Subscribe
- Mute
- Subscribe to RSS Feed
- Permalink
- Notify Moderator
Aug 22, 2012
10:10 AM
And again. The case was previously closed, but I've uploaded a new model and results that show this behaviour yet again.
This is starting to get annoying... if you run the same analysis through the same computer twice, you really should get the same answer. I know there's a percentage error in FE results, but it's just maths - it should produce the same mesh and get the same answer every time for a given geometry, whether it's run on its own or within a study.
Interestingly, I've only ever seen the sensitivity study produce a higher than 'normal' value - I've never yet seen it dip to a lower stress.
Aug 24, 2012
02:28 AM
- Mark as New
- Bookmark
- Subscribe
- Mute
- Subscribe to RSS Feed
- Permalink
- Notify Moderator
Aug 24, 2012
02:28 AM
In your first example, did you try to make a sensitivity study from 25.75 to 26.25 with 3 steps in order to see if the same problem occurs at 26?
Aug 24, 2012
06:52 AM
- Mark as New
- Bookmark
- Subscribe
- Mute
- Subscribe to RSS Feed
- Permalink
- Notify Moderator
Aug 24, 2012
06:52 AM
Thanks Sylvain - that's a good suggestion.
I've just run a test, and the sensitivity does return a consistent result for a given dimension value - so yes, the value at 26 would be the same regardless of the step size.
My colleague has come up with a theory as follows:
We know that for a sensitivity study, a 'clean' session of Pro/E is launched to regenerate the model each time. You can see this, because it places trail.txt.1, .2, .3... into the working directory for the analysis - therefore it does not read the normal config.pro.
Perhaps this 'clean' session regenerates the model to mid-limit dimensions, whereas our normal config.pro regenerates at the nominal value. In this case, the geometry would not be exactly the same as that produced by a 'normal' session of Pro/E, and so the mesh could be different which would ultimately cause the stresses to be different.
PTC have finally acknowledged the problem and filed SPR 2146259. They also report that running MPA in the sensitivity study gives the same result as the SPA single-analysis - I'm not sure whether this is really relevant...
Aug 24, 2012
07:26 AM
- Mark as New
- Bookmark
- Subscribe
- Mute
- Subscribe to RSS Feed
- Permalink
- Notify Moderator
Aug 24, 2012
07:26 AM
Let's investigate a little bit further:
In the first message, you said "More strangely, I then set the dimension to 26 and ran a single static analysis - and found a max_stress_vm of 1321 MPa, which fits the curve pretty much perfectly and disagrees with that high data point."
Could you try a single static analysis with the dimension sets to 25.75 in order to check the accuracy of this step of the sensitivity analysis?
Your colleague's theory could be true, but it doesn't explain the peak in the result's curve.
Aug 24, 2012
07:49 AM
- Mark as New
- Bookmark
- Subscribe
- Mute
- Subscribe to RSS Feed
- Permalink
- Notify Moderator
Aug 24, 2012
07:49 AM
I don't have the original model any more, but here are some results from the latest one that I've 'frozen' so that I can continue to investigate this:
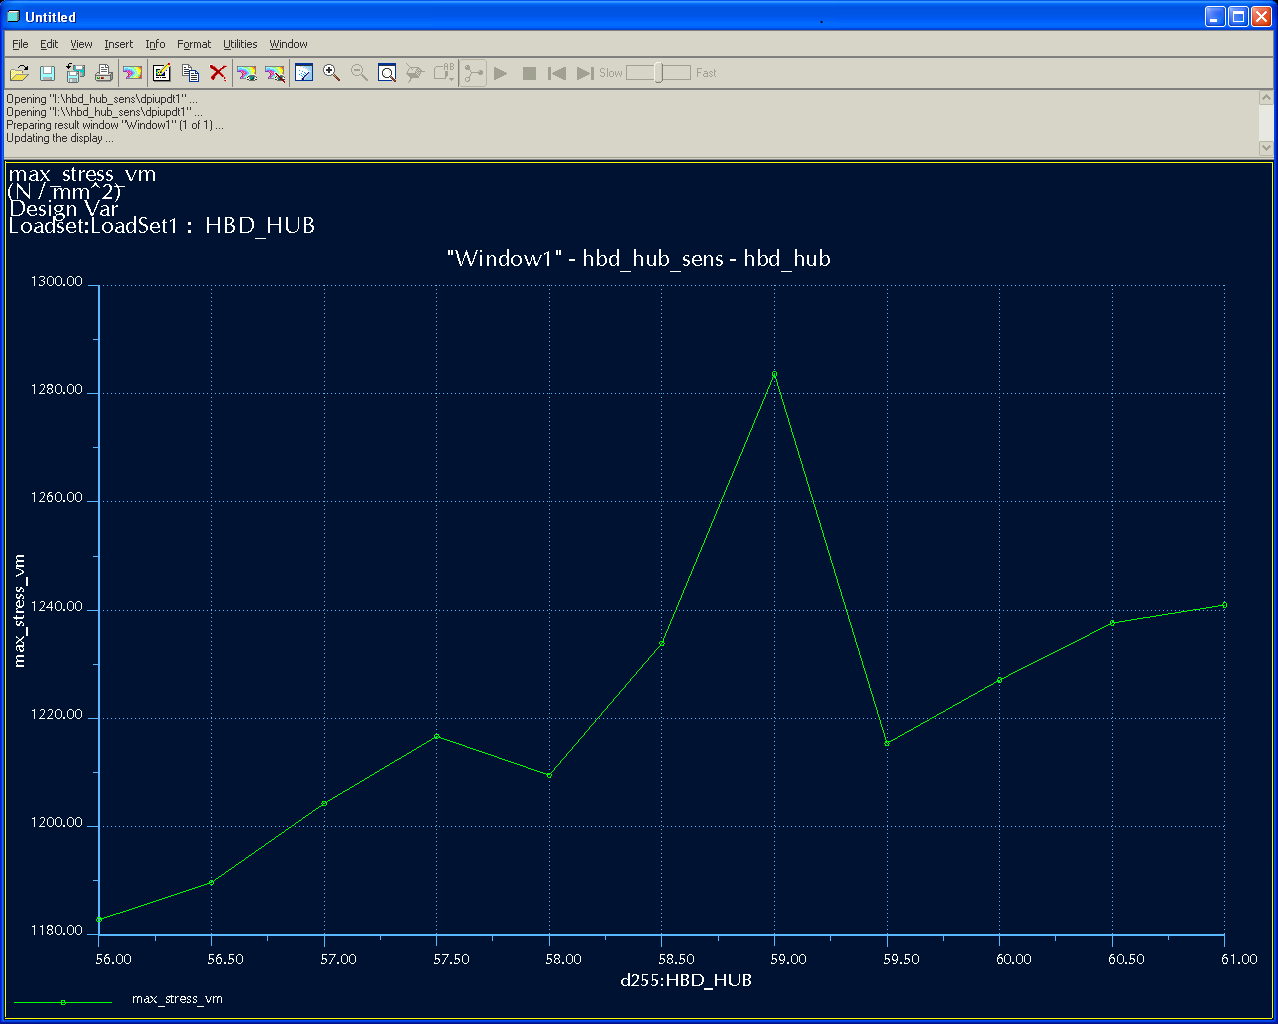
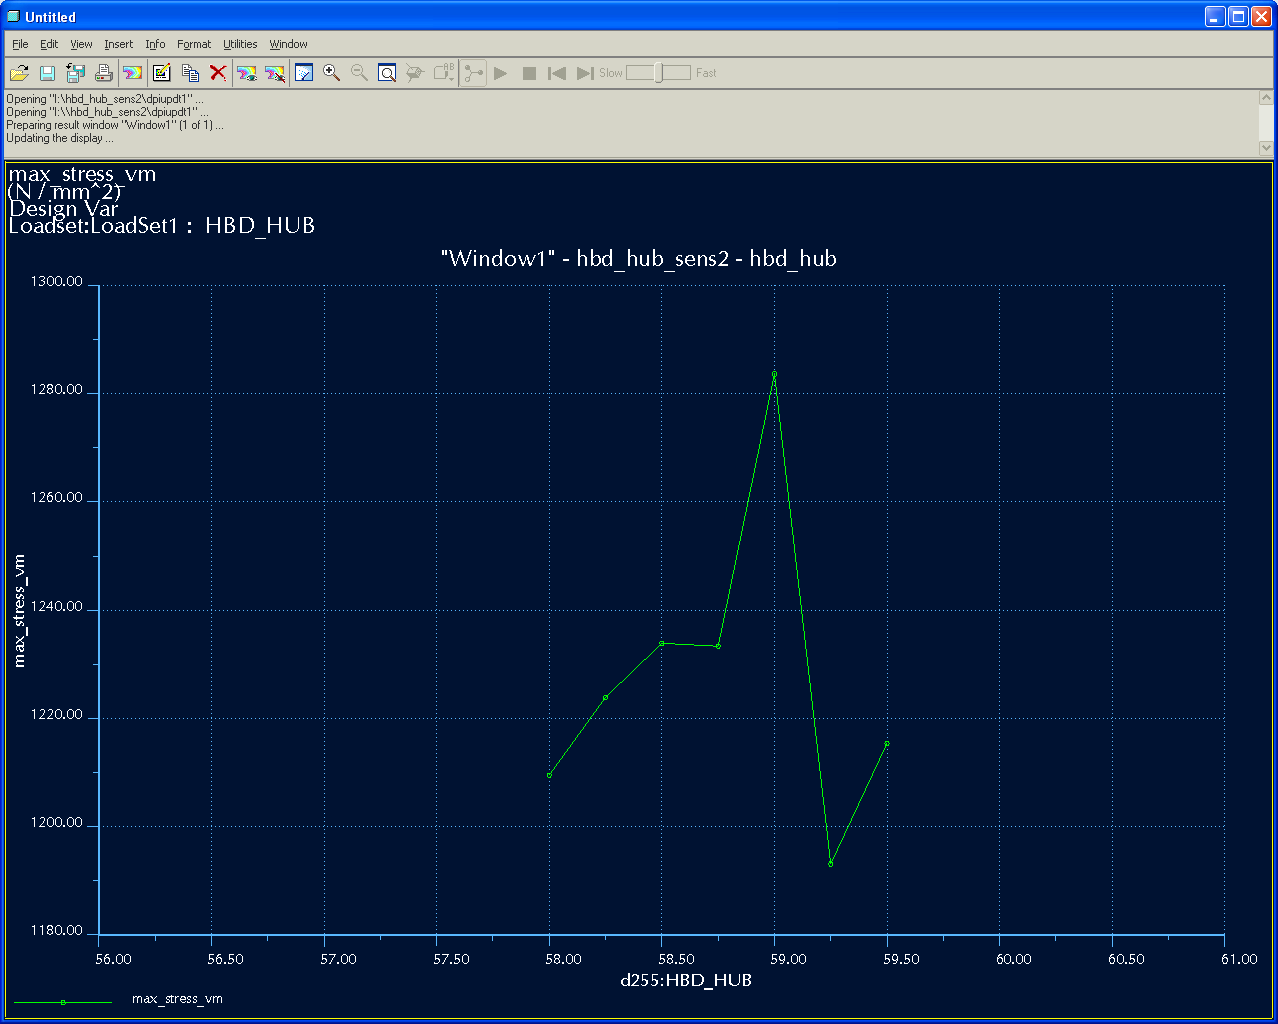
Single-run SPA results are as follows (fortunately, the run time for this model is around 7 seconds!):
58.00 1200 MPa
58.25 1221
58.50 1190
58.75 1209
59.00 1204 (confirmed by re-running)
59.25 1244
59.50 1214
So you can see that:
- both sets of values are slightly erratic, as you should expect from FEA
- the overall range (1190-1244 vs ~1192-1235) is about the same if you ignore the single point at 59
- every value is different to the Sensitivity Study results.
So perhaps there is really a convergence problem with the Sensitivity Study, especially as MPA apparently does not produce the high value - if the convergence criteria is somehow different then that could explain it.
Jul 30, 2015
06:38 AM
- Mark as New
- Bookmark
- Subscribe
- Mute
- Subscribe to RSS Feed
- Permalink
- Notify Moderator
Jul 30, 2015
06:38 AM
A possibly related issue: I've been running a lot of sensitivity studies recently, and I'm finding that the mesher within the study is less reliable than the mesher when accessed from the GUI. I've had a study trying to mesh the last step for over an hour now; I adjusted the model to the same values and ran the direct mesher, and it completed in 5.08 minutes.
Something's clearly different within a sensitivity study to the 'normal' interface.
Incidentally I've been experimenting with running sensitivity studies manually, pasting the measures into Excel after each step. This has several advantages:
- You can review each result step and decide whether to extend the study in one direction or the other; or to add more intermediate points;
- If one point fails, the whole analysis does not need to be re-run;
- You can generate the mesh for the next point while the previous point is still running, thus making better use of a multi-core CPU!
Aug 05, 2015
12:43 PM
- Mark as New
- Bookmark
- Subscribe
- Mute
- Subscribe to RSS Feed
- Permalink
- Notify Moderator
Aug 05, 2015
12:43 PM
One difference I can think of, is whether the measure uses the existing mesh (from a previous pass after variing the geometry) or not (which should be the case when you run from GUI for a fix geometry)
Gunter
Aug 10, 2015
07:23 AM
- Mark as New
- Bookmark
- Subscribe
- Mute
- Subscribe to RSS Feed
- Permalink
- Notify Moderator
Aug 10, 2015
07:23 AM
Thanks Gunter. I pretty much always select "Remesh after update" (and even when I don't it usually seems to remesh anyway) so this shouldn't be a factor.
Aug 07, 2015
04:39 AM
- Mark as New
- Bookmark
- Subscribe
- Mute
- Subscribe to RSS Feed
- Permalink
- Notify Moderator
Aug 07, 2015
04:39 AM
I have seen results like this when I make sensitivity plots of global measures such as "max_stress_vm". In such cases, the maximum von Mises stress, might occur at one location in the model, for a certain parameter setting, but in an entirely different location in the model for a different parameter setting. The measure vs.parameter plot then may appear discontinuous. In such a case, if you create local "at point-" or "near point-" or "over selected geometry-" measures this problem goes away. But I obviously can't verify if this is the case for your model.
Aug 10, 2015
07:26 AM
- Mark as New
- Bookmark
- Subscribe
- Mute
- Subscribe to RSS Feed
- Permalink
- Notify Moderator
Aug 10, 2015
07:26 AM
Thanks Mats.
I do use "over selected geometry" measures most of the time these days. However, this doesn't address the basic issue that running the same model gives different answers depending on whether it's standalone or within a study.
My most recent update about meshing is also weird - as I said before, it's just maths, and if you ask a computer to do the same maths (however complicated) twice, it should give you the same answer twice. This applies just as much to the meshing as to the stress results!
Aug 10, 2015
08:44 AM
- Mark as New
- Bookmark
- Subscribe
- Mute
- Subscribe to RSS Feed
- Permalink
- Notify Moderator
Aug 10, 2015
08:44 AM
Oh, I didn't realise you got different results in design study vs regular analysis, I thought it was the discontinuity that was the issue. Need to read more carefully... Strange though, as you point out, it should give roughly the same result. A small discrepancy would be understandable if mesh settings are slightly different when running design studies vs standalone, but not a significant one.
