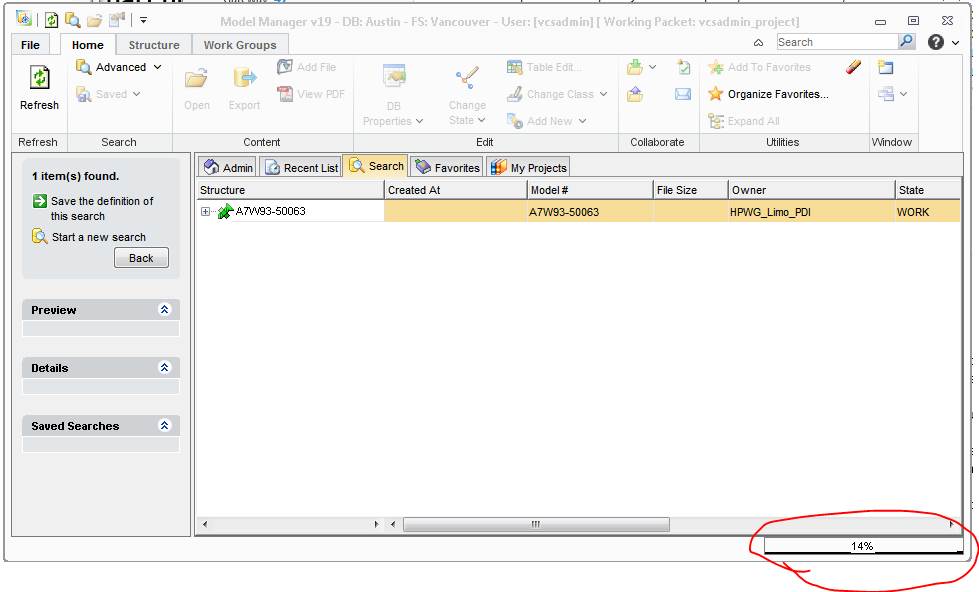
Solved! Go to Solution.
I assume it's a ratio between used memory and max memory as:
(total - free)/max
where:
- total: the total amount of memory in the Java virtual machine
- free: the amount of free memory in the Java Virtual Machine
- max: the maximum amount of memory that the Java virtual machine will attempt to use
When you press the mouse in this panel, it's supposed to run the garbage collector, a process where the Java Virtual Machine expends best efforts toward recycling unused objects in order to make the memory they currently occupy available for quick reuse.
Hi Louis and Pete,
The interesting part is how you get this panel.
I don't have it in my MM V19 😞
Cheers,
Max
Hey Max,
There are several conditions that make this panel appear. Let have a look at ManagerPanel.java, init().
The most current is when you debug the application from NetBeans..
Alternatively when your environment variable DEBUG_MM is "true".
Hope this helps you.
Louis and Pete,
The value (percentage) and behaviour is exacly Louis described.
Since MM ships with Java-Sources, you can look it up in
com\osm\ui\MemoryPanel.Java
The code also does a call to gc() which is the garbage collector when you click into the Window.
@Pete: You must be running DEBUG_MM=true - correct?
(from the sources, I clearly conclude that this Panel is only shown when debug is true)
Regards,
Max