- Subscribe to RSS Feed
- Mark as New
- Mark as Read
- Bookmark
- Subscribe
- Printer Friendly Page
- Notify Moderator
Announcing the Final Installment: JMeter for ThingWorx Comprehensive Guide and Best Practice Tips
Announcing the Final Installment
JMeter for ThingWorx, the Comprehensive Guide and Best Practice Tips
This is the final post on using JMeter for ThingWorx. Below there are best practice tips for using JMeter and for load testing in general. Attached to this post is a comprehensive guide including all of the information from every post we've made on JMeter, including the tutorials. For a more central source, feel free to download the guide , or see the past posts here:
- JMeter for ThingWorx (original post)
- Building More Complex Tests in JMeter
- Distributed Testing with JMeter
- Generating and Reviewing JMeter Results
JMeter Best Practice Tips
- Use Distributed Testing
- As already mentioned in a previous post, each JMeter client can only handle about 150-250 threads depending on the complexity of the tests, and each client will need around 1 CPU and up to 8 GB of RAM for the Java heap.
- Some test plans will run with fewer host resources, so resizing the test client VM up or down is often required during test development.
- Create a batch or shell script to start the multiple JMeter clients for greater ease of use.
- As already mentioned in a previous post, each JMeter client can only handle about 150-250 threads depending on the complexity of the tests, and each client will need around 1 CPU and up to 8 GB of RAM for the Java heap.
- Use Non-Graphical Mode
- Non-graphical mode allows the system to scale up higher; client processing uses up resources just to keep the simulation running, but with graphical mode turned off, there is less of an impact on the response times and other results.
- Graphical mode is essentially only used for debugging.
- Non-graphical mode allows the system to scale up higher; client processing uses up resources just to keep the simulation running, but with graphical mode turned off, there is less of an impact on the response times and other results.
- Turn off Embedded Resources
This setting reloads all of the typically cached requests over and over; there will be far more download requests, and to the exclusion of other requests, than is helpful.
- Ensure this box is not checked, especially in the HTTP Requests Defaults element:
- Browser caching means that this setting doesn’t actually simulate a proper user load, given that many of the reloaded resources would not be reloaded by actual users.
- Use this incrementally, for one or two HTTP requests only, if there is a reason why those requests might need to download fresh images, scripts, or other resources with each call; for instance, simulate page timeouts using this once per hour or something similar.
- Using this across the whole project will prevent it from scaling well, while not actually simulating real-world conditions.
- Avoid Using Listeners
- For instance, the “View Results Tree”, which uses additional resources that may impact the results in disingenuous ways, based around the needs of the clients themselves and not the actual response times of the server.
- Many listeners are only for debugging a handful of threads while designing the tests.
- A list of recommended listeners for different purposes is in JMeter documentation.
- Summary Report is the only one you want enabled, as that exports the results as a csv or similarly formatted file, which can then be used to build reports.
- For instance, the “View Results Tree”, which uses additional resources that may impact the results in disingenuous ways, based around the needs of the clients themselves and not the actual response times of the server.
- JMeter CAN handle SSO
- JMeter can authenticate into and test an SSO-enabled system.
- Sometimes the SSO configuration is essential for customers, and they may be quick to assume therefore that they cannot use JMeter, but that's not entirely true.
- Some external tools that might help with this are BlazeMeter (mentioned again in just a moment) and Fiddler, a good tool for decoding what data a particular SSO setup is exchanging during the authentication process.
- JMeter can authenticate into and test an SSO-enabled system.
- Use Logic Controllers for Parametrization
Parametrization is critical to mirroring a proper user load, and allowing different data sets to be queried or created; the load should seem organic, random in the right ways, with actions occurring at random times, not predictable times, to prevent seeing artificial peaks of usage that don’t represent real usage of the Foundation server.
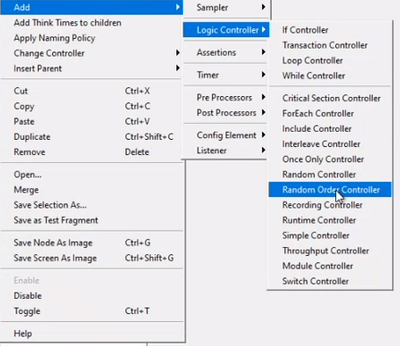
- Random order controllers direct the threads down different paths based on random dice rolls, allowing for a randomized collection of user activity each time, not something that has to be regenerated like a set of Boolean values that is specified in an input CSV and used to navigate a series of true or false switches.
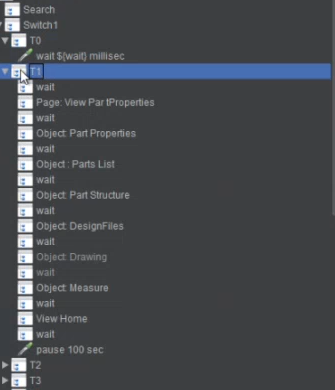
- Switches just look for an environment variable to be either 1 or 0, and when it hits a switch that’s a 1, it triggers the switch below, running them in the order given under the transaction controller that goes with the switch.
- In this image, the 1’s and 0’s are given in the CSV input file; randomizing that input file therefore randomizes the execution of the switches too:
- Use Commercial Add-Ons
- There are many external, add-on tools and plugins which enhance JMeter’s capabilities.
- One external tool that can enhance JMeter’s capabilities is Blazemeter, which has some free and some paid options to help create better reports, removing automatically much of the “garbage” REST calls (which would otherwise need to be manually deleted), and provide more consumable test reports right out of the box.
- Other tools and plugins include:
- Maven
- Netbeans
- SonarQube
- Jenkins
- Autometer
- Gradle
- Amazon EC2
- Lightning
- IntelliJ IDEA
- Cassandra
- Grafana
- For more best practice information, see the JMeter Best Practice Manual.
- There are many external, add-on tools and plugins which enhance JMeter’s capabilities.
General Load Testing Guidelines
- Concurrency Requirements – How to Properly Estimate the Size of the Load Test
- Take a brand new ThingWorx-based app. How people will be accessing the system and how often? How many are business users? How many are engineers? What do they do?
- Many assume that every named user in the corporate LDAP will need to access to the server, often 10s of thousands of users; this generally drastically oversizes the system.
- Load testing for many thousands of users is very hard and requires a lot of set-up, tuning, and optimization to get right; so if it seems that thousands of users are expected, then validating this claim is important: most customers don’t really have that many concurrent users in an engineering system.
-
Use estimates based on how many people work at which offices, which time zones those people are in, and what kinds of users they are. Do they need access to engineering data? Perhaps there are simpler mashups for them that uses less resources.
-
One tool for these sorts of estimations that PTC offers is the office time zone overlap Windchill Sizing Calculator (shown here)
-
Other ways to estimate include:
- Analyzing the business processes, things like how long workloads typically take to complete and how many workloads are generated per day, converted into hour, minute, or second as desired for the peak duration, the length of the test.
- “Day in the Life” modelling, or considering things like “what does user X do in a day?” Maybe, user X checks out some drawings, edits them, and then checks them back in at 4:30. Maybe user Y actually digs into the underlying parts and assemblies, putting in change requests or orders throughout the day, instead of waiting for the end. Models are made based around the types of users.
- Also consider:
- What are worst case scenarios?
- What are the longest running activities?
- What produces the largest data transfers?
- What activities have large, heavy data base queries?
- When is the peak overlap of usage?
- Beginning and end of day downloads and check ins?
- Reports that are generated regularly?
- How do these impact the foreground users?
- For a simpler estimate, start with a percentage of the named user count, anywhere from 5-15% is a good ballpark percentage.
- Don’t overestimate to feel like the application has been financially worth it; even if everyone is logged in and using it all at once, which is unlikely, load testing for every single user doesn’t take into account the fact that people pause in between clicking on things to think, type emails, get coffee, and so forth.
- Fewer people than expected are actually doing concurrent activities like loading web pages and updating data streams.
- Whenever possible, use concurrency data from existing customer systems to guide the estimate for the new system. Legacy system are great places to start.
- Analyzing the business processes, things like how long workloads typically take to complete and how many workloads are generated per day, converted into hour, minute, or second as desired for the peak duration, the length of the test.
- Take a brand new ThingWorx-based app. How people will be accessing the system and how often? How many are business users? How many are engineers? What do they do?
- Use Grafana to monitor the system side throughout the load test, which is also required to know the test has been successful; also set up Grafana to monitor the application once it goes live, to both prevent and mitigate more rapidly any technical issues with the server.
- Also remember that PTC Technical Support is here to help! Provide thread dumps with an open case to any TSE, and they will help troubleshoot the tests and review any errors in the ThingWorx or Tomcat logs.


