
Turn on suggestions
Auto-suggest helps you quickly narrow down your search results by suggesting possible matches as you type.
Showing results for
Turn on suggestions
Auto-suggest helps you quickly narrow down your search results by suggesting possible matches as you type.
Showing results for
Community Tip - When posting, your subject should be specific and summarize your question. Here are some additional tips on asking a great question. X
Options
- Subscribe to RSS Feed
- Mark as New
- Mark as Read
- Bookmark
- Subscribe
- Printer Friendly Page
- Notify Moderator
JVM Performance Monitoring Part 1: Troubleshooting GC logs
No ratings
Performance and memory issues in ThingWorx often appear at the Java Virtual Machine (JVM) level. We can frequently detect these issues by monitoring JVM garbage collection logs and thread dumps.
In this first of a multi-part series, let's discuss how to analyze JVM garbage collection (GC) logs to detect memory issues in our application.
What are GC logs? When enabled on the Apache server, the logs will show the memory usage over time and any memory allocation issues (See: How to enable GC logging in our KB for details on enabling this logging level). Garbage Collection logs capture all memory cleanup operations performed by the JVM. We can determine the proper memory configuration and whether we have memory issues by analyzing GC logs.
Where do I find the GC logs? When configured as per our KB article, GC logs will be written to your Apache logs folder. Check both the gc.out and the gc.restart files for issues if present, especially if the server was restarted when experiencing problems.
How do I read GC logs? There are a number of free tools for GC log analysis (e.g. http://gceasy.io, GCViewer). But GC logs can also be analyzed manually in a text editor for common issues.
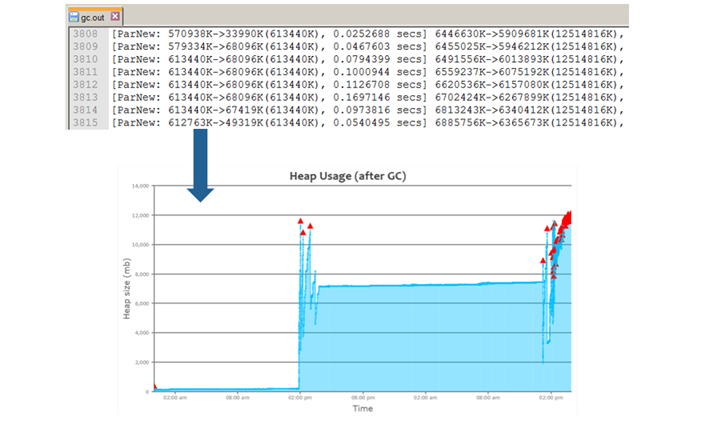
Reading GC files:
Generally each memory cleanup operation is printed like this:

Additional information on specific GC operations you might see are available from Oracle.
A GC analysis tool will convert the text representation of the cleanups into a more easily readable graph:
Three key scenarios indicating memory issues:
Let's look at some common scenarios that might indicate a memory issue. A case should be opened with Technical Support if any of the following are observed:
- Extremely long Full GC operations (30 seconds+)
- Full GCs occurring in a loop
- Memory leaks
Full GCs: Full GCs are undesirable as they are a ‘stop-the-world’ operation. The longer the JVM pause, the more impact end users will see:
- All other active threads are stopped while the JVM attempts to make more memory available
- Full GC take considerable time (sometimes minutes) during which the application will appear unresponsive
- Example – This full GC takes 46 seconds during which time all other user activity would be stopped:
- 272646.952: [Full GC: 7683158K->4864182K(8482304K) 46.204661 secs]
Full GC Loop: Full GCs occurring in quick succession are referred to as a Full GC loop
- If the JVM is unable to clean up any additional memory, the loop will potentially go on indefinitely
- ThingWorx will be unavailable to users while the loop continues
- Example – four consecutive garbage collections take nearly two minutes to resolve:
16121.092: [Full GC: 7341688K->4367406K(8482304K), 38.774491 secs]
16160.11: [Full GC: 4399944K->4350426K(8482304K), 24.273553 secs]
16184.461: [Full GC: 4350427K->4350426K(8482304K), 23.465647 secs]
16207.996: [Full GC: 4350431K->4350427K(8482304K), 21.933158 secs]
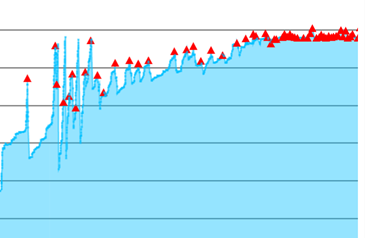
Example – the red triangles occurring at the end of the graph are a visual indication that we're in a full GC loop:
Memory Leaks: Memory leaks occur in the application when an increasing number of objects are retained in memory and cannot be cleaned up, regardless of the type of garbage collection the JVM performs.
- When mapping the memory consumption over time, a memory leaks appears as ever-increasing memory usage that’s never reclaimed
- The server eventually runs out of memory, regardless of the upper bounds set
Example(memory is increasing steadily despite GCs until we'll eventually max out):

What should we do if we see these issues occurring?
- Full GC loops and memory leaks require a heap dump to identify the root cause with high confidence
- The heap dump needs to be collected when the server is in a bad state
- Thread dumps should be collected at the same time
- A case should be opened with support to investigate available gc, stacktrace, or heap dump files
Comments
May 12, 2017
03:58 AM
- Mark as Read
- Mark as New
- Bookmark
- Permalink
- Notify Moderator
May 12, 2017
03:58 AM
good stuff Tudor!
May 18, 2017
06:15 PM
- Mark as Read
- Mark as New
- Bookmark
- Permalink
- Notify Moderator
May 18, 2017
06:15 PM
Hii Tudor Costache,
Thanks for sharing the details. It is good.
I have set the java option values as mentioned in the GC log settings mentioned in the above links. (I am not running tomcat as a service)
set JAVA_OPTS="-Djava.awt.headless=true -Djava.net.preferIPv4Stack=true -Dserver -Dd64 -Xms512m -Xmx5g -XX:+UseNUMA -Xloggc:logs/gc.out -XX:+PrintGCTimeStamps -XX:+PrintGCDetails"
But i am not getting the gc.out created. I have also tried giving the exact path differently like Xloggc:D:\gc.out. Still no GC logs getting created.
I have also tried to execute a data table query which results when i give bigger number in max items say 1000000000. but that error is not coming in the gc file mentioned. that log file itslef is not getting created in the given location.
Please let me know if i am missing anything.
Details:
OS : Windows 10
Tomcat version : 8.0.38
JDK : 1.8.0_b92
Thingworx : 7.1.0
May 22, 2017
01:43 AM
- Mark as Read
- Mark as New
- Bookmark
- Permalink
- Notify Moderator
May 22, 2017
01:43 AM
Has anybody else faced the problems similar to the above case?, If resolved, please post your comments here.
May 24, 2017
08:10 AM
- Mark as Read
- Mark as New
- Bookmark
- Permalink
- Notify Moderator
May 24, 2017
08:10 AM
I am able to get the GC logs by using the same configurations in windows configurations manager mentioned in the GC settings link. Thanks.
