
Turn on suggestions
Auto-suggest helps you quickly narrow down your search results by suggesting possible matches as you type.
Showing results for
Turn on suggestions
Auto-suggest helps you quickly narrow down your search results by suggesting possible matches as you type.
Showing results for
Community Tip - New to the community? Learn how to post a question and get help from PTC and industry experts! X
Options
- Subscribe to RSS Feed
- Mark as New
- Mark as Read
- Bookmark
- Subscribe
- Printer Friendly Page
- Notify Moderator
Prescriptive analytics
No ratings
There are four types of Analytics:
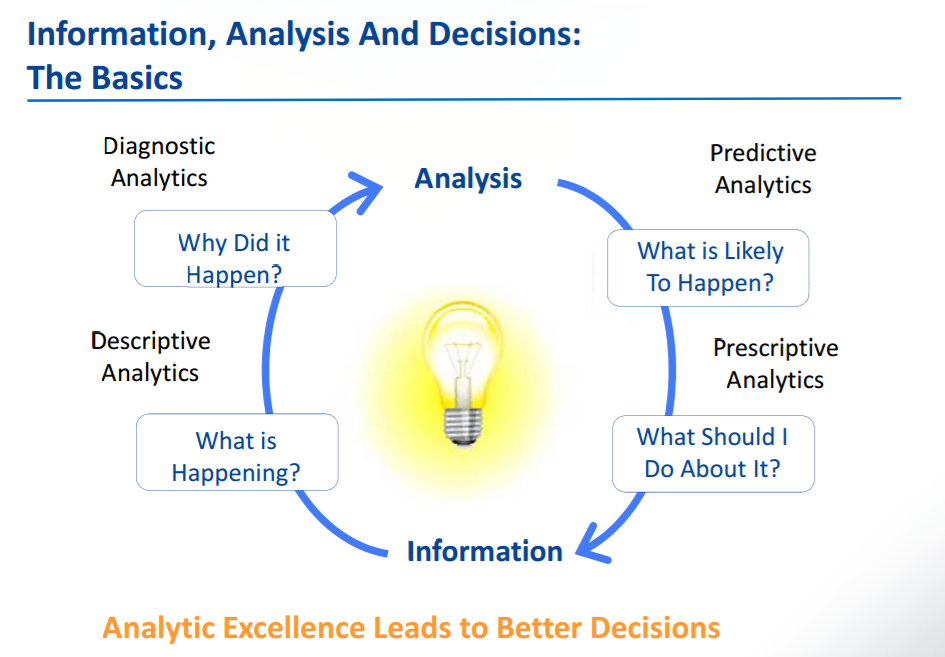
Prescriptive analytics: What should I do about it?
Prescriptive analytics is about using data and analytics to improve decisions and therefore the effectiveness of actions.Prescriptive analytics is related to both Descriptive and Predictive analytics. While Descriptive analytics aims to provide insight into what has happened and Predictive analytics helps model and forecast what might happen, Prescriptive analytics seeks to determine the best solution or outcome among various choices, given the known parameters.
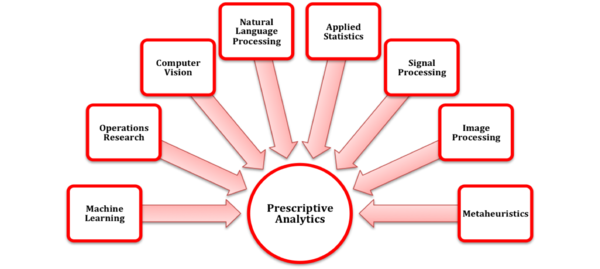
“Any combination of analytics, math, experiments, simulation, and/or artificial intelligence used to improve the effectiveness of decisions made by humans or by decision logic embedded in applications.”These analytics go beyond descriptive and predictive analytics by recommending one or more possible courses of action. Essentially they predict multiple futures and allow companies to assess a number of possible outcomes based upon their actions. Prescriptive analytics use a combination of techniques and tools such as business rules, algorithms, machine learning and computational modelling procedures.
Prescriptive analytics can also suggest decision options for how to take advantage of a future opportunity or mitigate a future risk, and illustrate the implications of each decision option. In practice, prescriptive analytics can continually and automatically process new data to improve the accuracy of predictions and provide better decision options.
Prescriptive analytics can be used in two ways:
Inform decision logic with analytics: Decision logic needs data as an input to make the decision. The veracity and timeliness of data will insure that the decision logic will operate as expected. It doesn’t matter if the decision logic is that of a person or embedded in an application — in both cases, prescriptive analytics provides the input to the process. Prescriptive analytics can be as simple as aggregate analytics about how much a customer spent on products last month or as sophisticated as a predictive model that predicts the next best offer to a customer. The decision logic may even include an optimization model to determine how much, if any, discount to offer to the customer.
Evolve decision logic: Decision logic must evolve to improve or maintain its effectiveness. In some cases, decision logic itself may be flawed or degrade over time. Measuring and analyzing the effectiveness or ineffectiveness of enterprises decisions allows developers to refine or redo decision logic to make it even better. It can be as simple as marketing managers reviewing email conversion rates and adjusting the decision logic to target an additional audience. Alternatively, it can be as sophisticated as embedding a machine learning model in the decision logic for an email marketing campaign to automatically adjust what content is sent to target audiences.
Different technologies of Prescriptive analytics to create action:
- Search and knowledge discovery: Information leads to insights, and insights lead to knowledge. That knowledge enables employees to become smarter about the decisions they make for the benefit of the enterprise. But developers can embed search technology in decision logic to find knowledge used to make decisions in large pools of unstructured big data.
- Simulation: Simulation imitates a real-world process or system over time using a computer model. Because digital simulation relies on a model of the real world, the usefulness and accuracy of simulation to improve decisions depends a lot on the fidelity of the model. Simulation has long been used in multiple industries to test new ideas or how modifications will affect an existing process or system.
- Mathematical optimization: Mathematical optimization is the process of finding the optimal solution to a problem that has numerically expressed constraints.
- Machine learning: “Learning” means that the algorithms analyze sets of data to look for patterns and/or correlations that result in insights. Those insights can become deeper and more accurate as the algorithms analyze new data sets. The models created and continuously updated by machine learning can be used as input to decision logic or to improve the decision logic automatically.
- Paragmetic AI: Enterprises can use AI to program machines to continuously learn from new information, build knowledge, and then use that knowledge to make decisions and interact with people and/or other machines.
Use of Prescriptive Analytics in ThingWorx Analytics:
Thing Optimizer: Thing Optimizer functionality provides the prescriptive scoring and optimization capabilities of ThingWorx Analytics.
While predictive scoring allows you to make predictions about future outcomes, prescriptive scoring allows you to see how certain changes might affect future outcomes. After you have generated a prediction model (also called training a model), you can modify the prescriptive attributes in your data (those attributes marked as levers) to alter the predictions. The prescriptive scoring process evaluates each lever attribute, and returns an optimal value for that feature, depending on whether you want to minimize or maximize the goal variable.
Prescriptive scoring results include both an original score (the score before any lever attributes are changed) and an optimized score (the score after optimal values are applied to the lever attributes). In addition, for each attribute identified in your data as a lever, original and optimal values are included in the prescriptive scoring results.
How to Access Thing Optimizer Functionality:
ThingWorx Analytics prescriptive scoring can only be accessed via the REST API Service. Using a REST client, you can access the Scoring service which includes a series of API endpoints to submit scoring requests, retrieve results, list jobs, and more. Requires installation of the ThingWorx Analytics Server.
How to avoid mistakes - Below are some common mistakes while doing Prescriptive analytics:
- Starting digital analytics without a clear goal
- Ignoring core metrics
- Choosing overkill analytics tools
- Creating beautiful reports with little business value
- Failing to detect tracking errors
Image source: Wikipedia, Content: go.forrester.com(Partially)
Comments
Aug 18, 2019
05:04 AM
- Mark as Read
- Mark as New
- Bookmark
- Permalink
- Notify Moderator
Aug 18, 2019
05:04 AM
I am confused about the scoring part. what does the value of prescriptive score mean? I saw decimals eg 0.4567 for both optimized score and original score in (prescriptive realtime score). What is the meaning of eg 0.4567?
In predictive scoring(realtime score), i can see the 'goal' which is the prediction and 'goal_mo' which is also 0.4567. What is 'goal_mo' and is this the same value shown in prescriptive thing?
Aug 19, 2019
05:05 AM
- Mark as Read
- Mark as New
- Bookmark
- Permalink
- Notify Moderator
Aug 19, 2019
05:05 AM
_mo stands for "model output", and it's the number returned by the algorithm.
The used algorithms usually work with inputs being numerical and in the 0..1 range, so any training data is usually transformed to that interval first. The result(score) is then transformed back to it's original scale (which also can mean mapping it to true/false).
In your prescription case, the system couldn't find a better score with the levers and ranges you provided, that's why both values are the same.
Aug 19, 2019
08:45 AM
- Mark as Read
- Mark as New
- Bookmark
- Permalink
- Notify Moderator
Aug 19, 2019
08:45 AM
I have a few question on this
1.
Is this _mo in predictive thing used in the prescriptive thing as well?
2.
In my case, the goal i want to maximise is this field called 'Goal' which is strings : 'good', 'normal', 'bad'
Is the process like this?
correct me if i am wrong:
1: The inputs eg vibration/ temperature readings are scaled to 0,1 to train
2: During testing/scoring phase, the inputs are scaled too.
3. The output aka _mo is being output as between 0-1 and scaled back to original scale.
4. using the scaled output the model will map to the corresponding strings
But in this case how will the model know what the definition of good, normal, bad as i nvr specifiy what is good?
In this case how does optimization even happen?
Aug 19, 2019
08:57 AM
- Mark as Read
- Mark as New
- Bookmark
- Permalink
- Notify Moderator
Aug 19, 2019
08:57 AM
There is something called one-hot encoding for categories, where if you have 3 categories, the system internally make 3 boolean columns from it (think of it as denormalization), flagging 1 if the category is met, and 0 otherwise.
Then (also internally) it computes the scores for the three goals. Whichever has the highest rating, will get the "vote".
Let's say we have categories low, mid, high, and the scores are then 0.32, 0.85 and 0.44 respectively. Then the resulting category would be "mid".
With a categorical goal, there should be more than just the one number in the output, there should be also an field indicating the category.
Aug 19, 2019
09:07 AM
- Mark as Read
- Mark as New
- Bookmark
- Permalink
- Notify Moderator
Aug 19, 2019
09:07 AM
But that does not seem to be the case when i tried using the real time scoring in prescriptive thing.
I get the result as shown below with no categories.

Aug 19, 2019
10:26 AM
- Mark as Read
- Mark as New
- Bookmark
- Permalink
- Notify Moderator
Aug 19, 2019
10:26 AM
Sorry, my previous answer referred to Predictive Scoring only.
Prescriptive Analytics tries to optimize the outcome, that's why when calling the scoring service, you define maximize as true or false, depending on the goal. But this only makes sense if you goal variable supports a notion of "more is better" or "less is better". With a categorical goal, this question can't be answered. To the system, your good/normal/bad is the same as red/green/blue or fish/bird/dog - there is no implicit order in them, so the system can't optimize.
I'm not sure if this is a supported use case, but you would need at least an ordinal goal, which is a categorical goal with an order, so you can let the system know that bad
Aug 19, 2019
11:16 AM
- Mark as Read
- Mark as New
- Bookmark
- Permalink
- Notify Moderator
Aug 19, 2019
11:16 AM
Ok, I've run an example, and prescriptive scoring doesn't support categorical goals in the first place (for the reasons I sketched).
If you try to run it on a model with a categorical goal, you will get this message:
Could not process request: [Cannot perform prescriptive scoring on a non-numeric goal [refer to logs for more details]]
Maybe you can try to re-phrase the analytical question to a numeric instead of a categorical goal.
Aug 19, 2019
11:49 AM
- Mark as Read
- Mark as New
- Bookmark
- Permalink
- Notify Moderator
Aug 19, 2019
11:49 AM
I am still a bit hazy about the prescriptive analytics concept on thingworx. Is there a guide with example for me to try on? Or any recommended datasets?
Aug 20, 2019
04:47 AM
- Mark as Read
- Mark as New
- Bookmark
- Permalink
- Notify Moderator
Aug 20, 2019
04:47 AM
I am not aware of a prescriptive tutorial, but you will find some information in this community, here's a pre-fab mashup where you can have a look into the code as well:
https://community.ptc.com/t5/IoT-Tech-Tips/Prescriptions-Mashup-for-Thingworx-Analytics/m-p/573930
For a dataset, you would ideally use something with a continuous goal, like the CCPP dataset where you try to predict power output:
https://archive.ics.uci.edu/ml/datasets/combined+cycle+power+plant
Aug 20, 2019
06:42 AM
- Mark as Read
- Mark as New
- Bookmark
- Permalink
- Notify Moderator
Aug 20, 2019
06:42 AM
I see. The link seems helpful so i will most probably try it.
I am planing to work with time series datasets so the question is:
Does thingworx prescriptive thing work with time series datasets?
I was reading up on how prescriptive analytics can in real time suggesting actions to benefit from the predictions and show the implications of each decision option on the end goal eg. profit so i wonder if thingworx has such functionality.
Aug 20, 2019
07:56 AM
- Mark as Read
- Mark as New
- Bookmark
- Permalink
- Notify Moderator
Aug 20, 2019
07:56 AM
I haven't tried this before. Technically, time series are transformed and handled like non-time series data, because the learner algorithms don't really support the concept of "time".
Question is, how much time do you need to know in advance to react, because this also defines the lookahead.
I don't think it's possible to use prescription in a meaningful way with a lookahead>1 timeunits.
Aug 23, 2019
02:40 AM
- Mark as Read
- Mark as New
- Bookmark
- Permalink
- Notify Moderator
Aug 23, 2019
02:40 AM
In thingworx learners, does it support support rnn like gru and lstm as these seems to perform better in time series.
Aug 23, 2019
03:42 AM
- Mark as Read
- Mark as New
- Bookmark
- Permalink
- Notify Moderator
Aug 23, 2019
03:42 AM
No. There are a lot of specific ML algorithms around that perform better in certain situations, but that's not the goal of Thingworx Analytics. TWA addresses users that are NOT data scientists, but still want to get the job done. So PTC provides a couple of algorithms that perform best for the usual usecases the customers have and that don't require knowledge about machine learning.
A data scientist-created model might out-perform a TWA-auto-created model, but at the cost of time and knowledge needed to create that model.
If you are a data scientist or need to use learners other than the ones TWA has included or need a more elaborated model, you can always bring your own an import it to TWA, as long as it is in format PMML-4.3.
Aug 23, 2019
05:07 AM
- Mark as Read
- Mark as New
- Bookmark
- Permalink
- Notify Moderator
Aug 23, 2019
05:07 AM
Interestingly, i realize that you can get the the following error for wrong range input. How does the TWA determine the correct boundary for this dataset?
Failed to score: Invalid range specified for the continuous field [Cement].
Acceptable bound(s): [102.0,540.0]
Aug 23, 2019
05:17 AM
- Mark as Read
- Mark as New
- Bookmark
- Permalink
- Notify Moderator
Aug 23, 2019
05:17 AM
It's most probably the min and max value of the training data. The system can't make predictions beyond the range it has seen in the training.
Sep 02, 2019
09:12 AM
- Mark as Read
- Mark as New
- Bookmark
- Permalink
- Notify Moderator
Sep 02, 2019
09:12 AM
Hi,
is it possible to briefly explain how the prescriptive analytics finds the values to maximise or minimise the goal? I got a little confused as the model i trained on is a mashup of neural network and some other algorithm. From what i understand, it acts like a black box with a lot of functions in the background so it seem to be impossible to find the global max or min.
Does Thingworx(prescriptive analytics) use brute force on all the possible values of the chosen levers to find the most optimal value?
Sep 03, 2019
08:44 AM
- Mark as Read
- Mark as New
- Bookmark
- Permalink
- Notify Moderator
Sep 03, 2019
08:44 AM
How it _exactly_ works is beyond my knowledge, but you can imagine it as looking for maxima on an (n-1) dimensional hyperplane by walking around on the surface. Each variable you define as a lever is one direction of walking around and looking for "better" outcomes.
Not sure it is looking for the global maximum, also it is not using the full vectorspace (brute-force) to find those values - this would be computationally too expensive, even if it was a discrete space. It's it using some smart way to find where it is best to look for better scores.
But the general approach is to repeatedly adjust the levers and see how the adjusted input scores.
Sep 17, 2019
11:52 AM
- Mark as Read
- Mark as New
- Bookmark
- Permalink
- Notify Moderator
Sep 17, 2019
11:52 AM
During pre-sales I often get asked by customers about the details on how TWA works under-the-hood. Is it documented somewhere, besides the info in help center?
I mean, I can explain DS concepts to people, but the people asking such questions already have some DS expertise and they want to know what approaches are implemented in TW Analytics to try to estimate quality of the models and predictions they'll be getting, otherwise they're reluctant to trust the "black box" software.
Even if we persuate the decision maker and win the deal, having a sceptical DS guy who will be implementing the solution will not be benefical to the project.
Yes, predictions themselves is just one piece of TW and TWA functionality and the product has other major benefits which I communicate during pre-sales, but I couldn't find a good way to handle such kind of questions.
Sep 18, 2019
01:55 PM
- Mark as Read
- Mark as New
- Bookmark
- Permalink
- Notify Moderator
Sep 18, 2019
01:55 PM
Well if it is someone familiar with Data Science, the used machine learning algorithms should be familiar, and users can choose them from a list - therefore predictive analytics is not a black box, but a white box - TWA even gives a measure of the quality of the model!
Prescriptive analytics was more or less explained in this post, which leaves Signals and Profiles.
Signals use mutual information instead of correlation because this works also with non-linear relationships.
How Profiles work is using a beam search algorithm.
If you are in a Pre-Sales role in PTC or a partner, you're eligible to analytics training, where this is explained more in detail.
Sep 19, 2019
12:03 AM
- Mark as Read
- Mark as New
- Bookmark
- Permalink
- Notify Moderator
Sep 19, 2019
12:03 AM
Personally, as a user i think that Thingworx is a great platform for the non technical to use it as 'black box' tool. For DS people, it indeed serves as a white box. However, there will bound be users that may be unfamiliar with some of the newer concepts like prescriptive analytics which i personally feel that there should be clearer explanations of the features for non DS and DS people. (E.g. a tutorial which they can follow to understand. I feel that the concrete example was great!)
For DS people, a separate section that goes more in depth into the features like the meaning behind the numbers/signels or even a brief explanation on what is going on behind the scenes will also be beneficial for both the sales team and end user as well.
Sep 19, 2019
01:12 PM
- Mark as Read
- Mark as New
- Bookmark
- Permalink
- Notify Moderator
Sep 19, 2019
01:12 PM
Thank you for the prompt response, @Rocko
Special kudos for mentioning the type of math behind profiles - this is the kind of information I'm looking for. I actually thought it was based on frequent pattern mining, something like fp growth or apriori.
And thank you for mentioning the training - I've checked the materials from it and there is indeed a lot of information to which I either didn't pay attention back then or which wasn't emphasized during the training. Even beam search is there.
