Community Tip - Stay updated on what is happening on the PTC Community by subscribing to PTC Community Announcements. X
- Subscribe to RSS Feed
- Mark Topic as New
- Mark Topic as Read
- Float this Topic for Current User
- Bookmark
- Subscribe
- Mute
- Printer Friendly Page
Bode Plot - NaN/Complex values Error and Plot Grid Does Not Exist in Mathcad Prime 7
- Mark as New
- Bookmark
- Subscribe
- Mute
- Subscribe to RSS Feed
- Permalink
- Notify Moderator
Bode Plot - NaN/Complex values Error and Plot Grid Does Not Exist in Mathcad Prime 7
Hello,
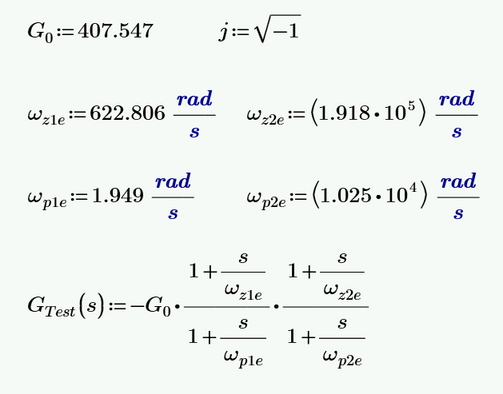
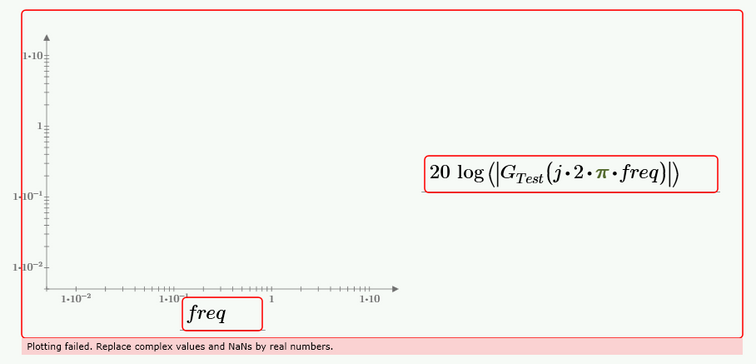
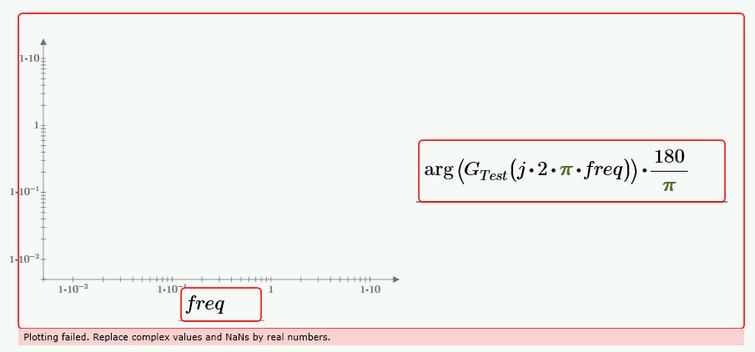
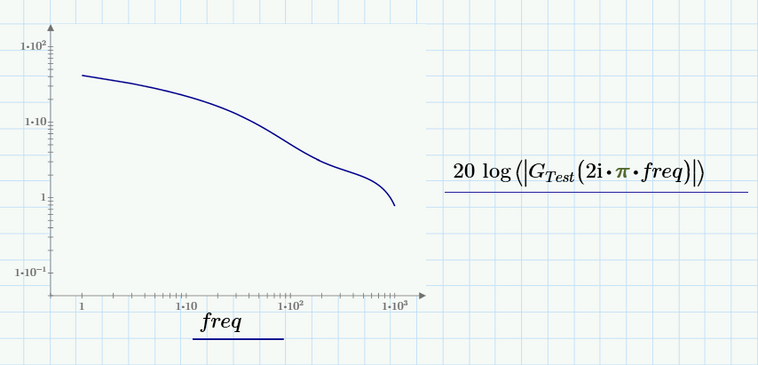
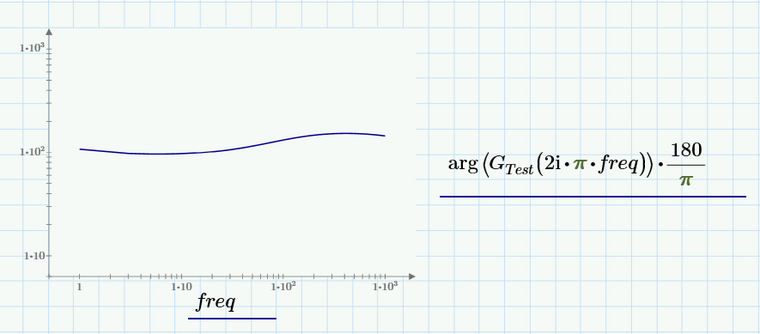
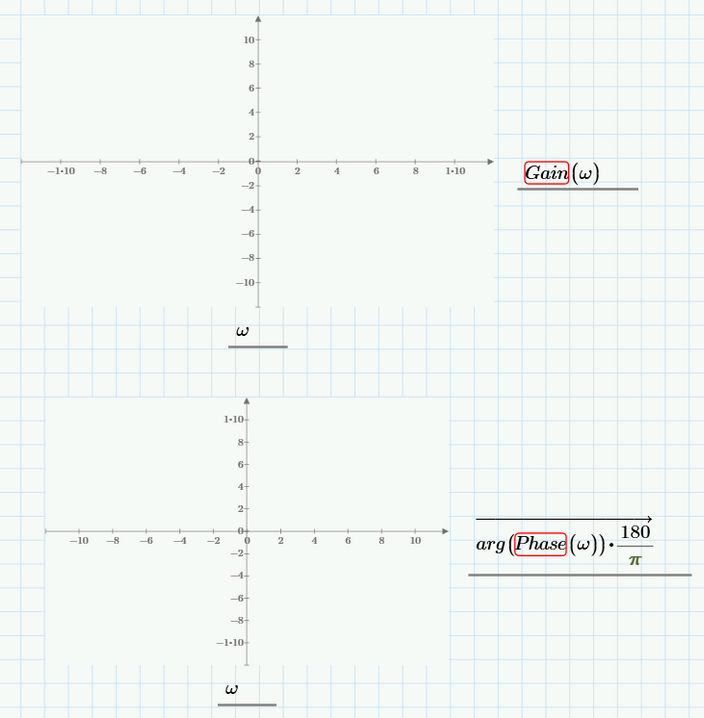
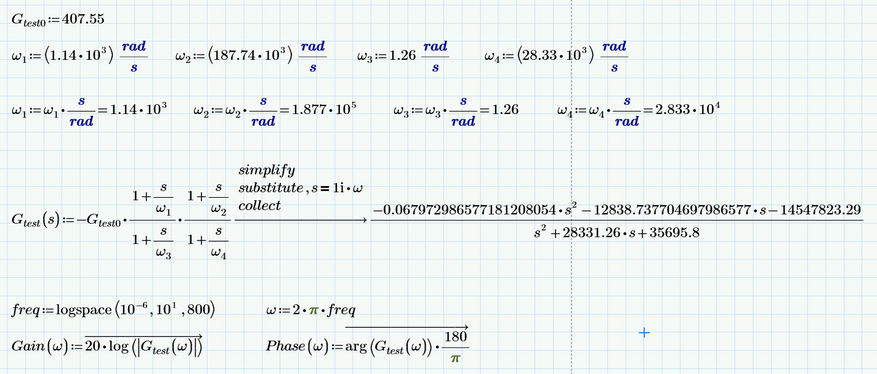
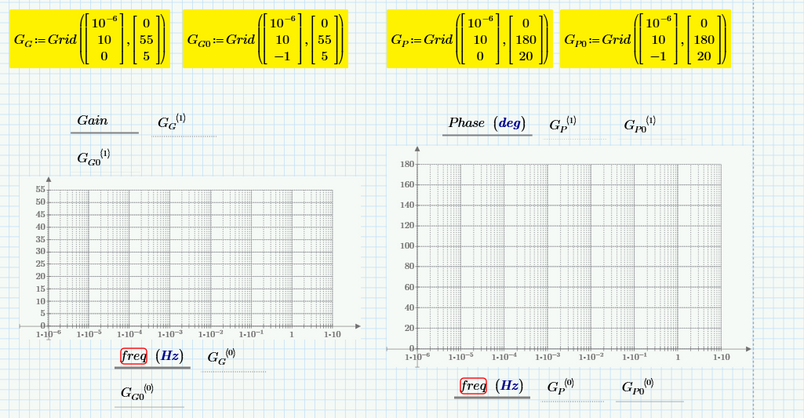
How can I get rid of that error in red below? I want to plot the Bode graphs of amplitude-frequency and phase-frequency in Mathcad Prime 7.
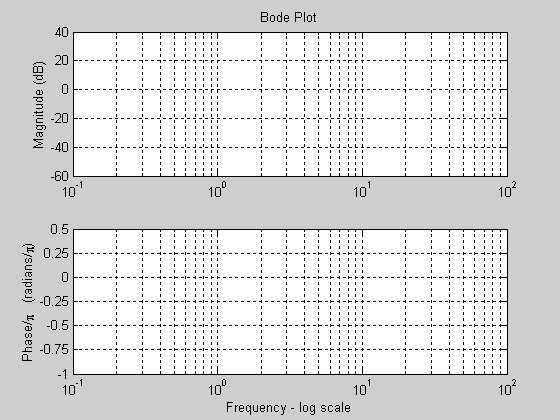
Also, I want to have grid on in these graphs. How can I do that in Mathcad Prime 7?
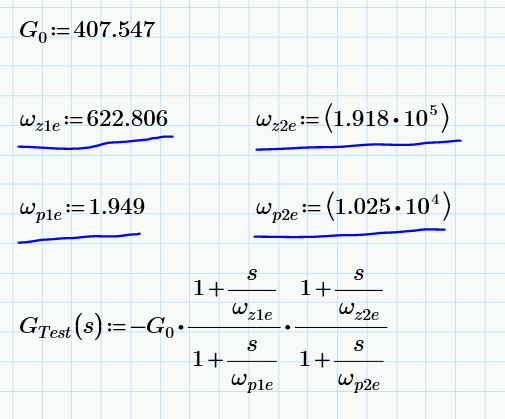
Mathcad Prime 7 file is attached.
Thank you.
Solved! Go to Solution.
- Labels:
-
Electrical_Engineering
Accepted Solutions
- Mark as New
- Bookmark
- Subscribe
- Mute
- Subscribe to RSS Feed
- Permalink
- Notify Moderator
You left freq undefined, so Prime will try to range freq from -10 to 10. Of course that doesn't work on a logarithmic scale. In addition freq needs a unit (Hz or so).
You can solve this problem simply by defining freq as:
But this creates a lot of superfluous points for a log scale. And when you want to go over 6 decades it's not going to work.
You can use logpts() or logspace() to generate a vector of logarithmically spaced points for freq:
To get 10 points per decade from 10^0(=1) to 10^3(=1000) Hz.
Now you need to vectorise the plot expressions.
You can use the unit deg instead of multiplying the argument with 180/pi, and i is a predefined constant, you don't need to define j.
This gets:
and
Success!
Luc
- Mark as New
- Bookmark
- Subscribe
- Mute
- Subscribe to RSS Feed
- Permalink
- Notify Moderator
It is a little strange because if I do not put the units (meaning rad/s) for wze1, wze2, wpe1, wpe2 then 1) I do not need to define any freq, 2) I do not need to vectorize anything and 3) the graphs are displayed. Do you know an explanation for this thing?
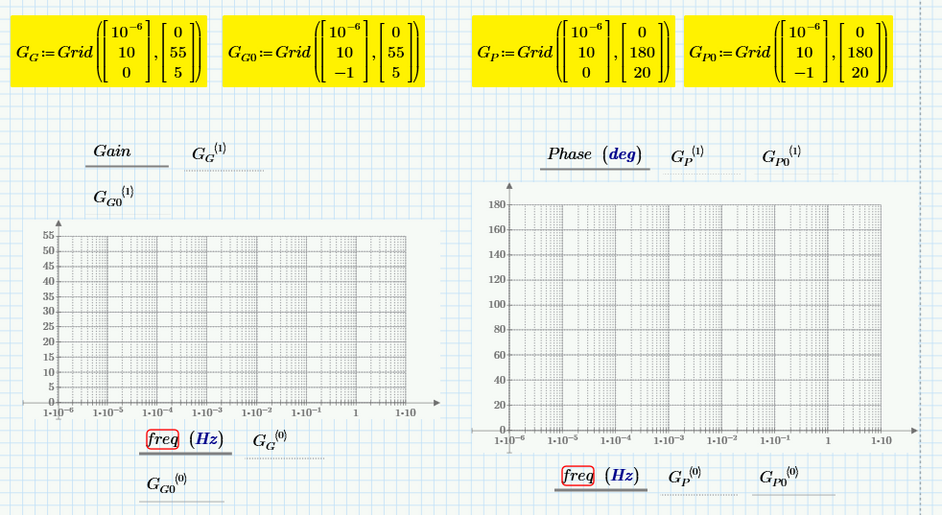
And do you know how to put grid on the graphs in Mathcad Prime 7? Can you tell me how to do this?
Grid like:
Thank you.
- Mark as New
- Bookmark
- Subscribe
- Mute
- Subscribe to RSS Feed
- Permalink
- Notify Moderator
The native plot function of Prime does not provide for Grids. But you can make your own.
Attached sheet contains a utility.
The reason that the plot works when you strip all units, is because freq, if undefined, gets an automatic range but without units. (The automatic range is -10 to 10 for linear scales, and appears to be 0.4 to 10 for log scales.)
Having units in your omega's but not in your s's causes inconsistent units in the transfer function Gtest, where you add 1 (no units) to s/omega, and only omega has a unit. You're trying to add apples to pears...
Success!
Luc
- Mark as New
- Bookmark
- Subscribe
- Mute
- Subscribe to RSS Feed
- Permalink
- Notify Moderator
Luc beat me to the reply and gets (at least partial) credit for the gridlines. See attached Prime 7 file
- Mark as New
- Bookmark
- Subscribe
- Mute
- Subscribe to RSS Feed
- Permalink
- Notify Moderator
Why units are not simplified after division with respective units (1V, 1H, 1F, 1ohm), and therefore the obtained expression being without any units?
I want to obtain Gtest(s) without any units even if initially V1, L1, C1, R1 have units.
And then I want to plot the bode plot of Gtest(s)
- Mark as New
- Bookmark
- Subscribe
- Mute
- Subscribe to RSS Feed
- Permalink
- Notify Moderator
How to use complex frequency s is important. You can use 1j*2*pi*freq instead s.
- Mark as New
- Bookmark
- Subscribe
- Mute
- Subscribe to RSS Feed
- Permalink
- Notify Moderator
Thank you.
- Mark as New
- Bookmark
- Subscribe
- Mute
- Subscribe to RSS Feed
- Permalink
- Notify Moderator
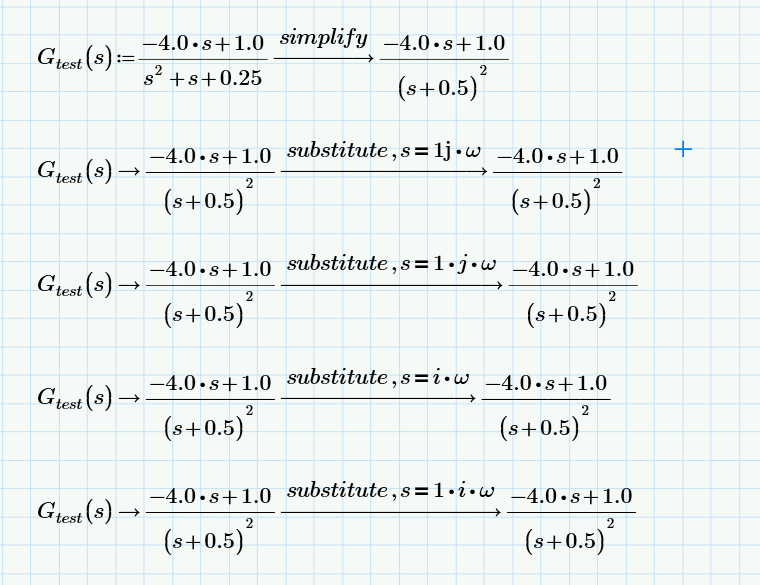
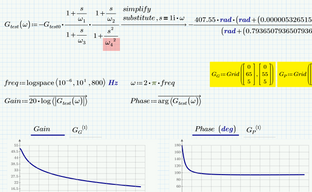
Strange thing happens with this substitute (symbolic operator) in Mathcad Prime 7...🤔
@ttokoro Can you also upload your worksheet in such a way to be compatible with Mathcad Prime 7? (I think that your worksheet is done in Mathcad Prime 8, but I do not have Mathcad Prime 8. I have only Mathcad Prime 7 at this moment). Thank you.
- Mark as New
- Bookmark
- Subscribe
- Mute
- Subscribe to RSS Feed
- Permalink
- Notify Moderator
There is a severe and very annyoing bug in Prime: Auto-labeling does very often not work correct , especially with symbolic operations.
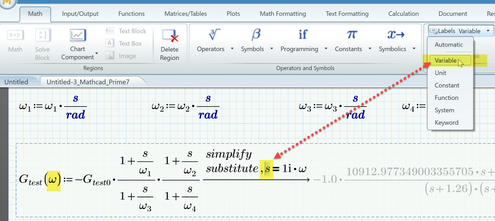
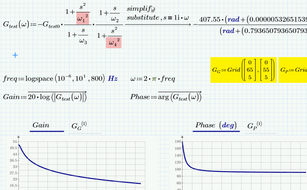
If you check your expressions you will see that all "s" are labelled "Variable", but the "s" after "substitute" is labelled "-", which means "automatic". For the symbolic evaluation this is not the same "s" as in the expression and so nothing is substituted.
Solution is to manually label all variables the same - either all "automatic" or all "Variable". Of course in your example label the "s" after substitute to "Variable" is the easiest approach:
Even though you may globally set the display of the imaginary unit as "j", the symbolics unfortunately ignores that setting and always uses "i".
P.S.: I modified ttokoros sheet and attach it here. I think you should be able to open it with your version now.
- Mark as New
- Bookmark
- Subscribe
- Mute
- Subscribe to RSS Feed
- Permalink
- Notify Moderator
- Mark as New
- Bookmark
- Subscribe
- Mute
- Subscribe to RSS Feed
- Permalink
- Notify Moderator
Mathcad has always struggled with symbolic evaluation, so much so that I used to preach against using it, So the symbolic solver creates the correct function, but the "i" it writes is an undefined variable, NOT the imaginary constant you wanted it to be.
If you add one line:
Then you can get:
Another option (dangerous IMHO) would be to define the variable:
- Mark as New
- Bookmark
- Subscribe
- Mute
- Subscribe to RSS Feed
- Permalink
- Notify Moderator
Even though the display is ugly looking in Prime, you have to use 1i or 1j (without a space inbetween) for the imaginary unit, not just i or j.
In real Mathcad you have to do likewise, but the expression will be displayed nicer without the "1".
Prime recognizes 1i and 1j likewise and you can set for numeric evaluations how Prime should display complex numbers - with 1i or with 1j or using the versor symbol ...
The symbolic evaluation ignores this setting and will always use 1i.
So in your example you should use "...substitute,s=1i*omega.."
Furthermore its not necessary to torn Gain and Phase into functions of omega, unless you need it that way in later calculations.
- Mark as New
- Bookmark
- Subscribe
- Mute
- Subscribe to RSS Feed
- Permalink
- Notify Moderator
Start to get annoying using this Mathcad Prime... you go crazy how much headache gives you when using symbolic and graphic in Mathcad Prime, while in Mathcad15 they didn't give you such a headache
Those from PTC are making fun of this Mathcad Prime...
- Mark as New
- Bookmark
- Subscribe
- Mute
- Subscribe to RSS Feed
- Permalink
- Notify Moderator
I agree that working (maybe I should rater say "playing around") with Prime can be quite "funny" (in the sense of annoying, to despair, to freak out,...).
But you can't blame Prime for you using "i" instead of "1i" 🙂
It was the very same in Mathcad 15, too.
- Mark as New
- Bookmark
- Subscribe
- Mute
- Subscribe to RSS Feed
- Permalink
- Notify Moderator
@ttokoro @Werner_E @LucMeekes @Fred_Kohlhepp
Another headache...
I do not know how to reconcile these units of measurement in Mathcad Prime...they causes headaches...
First I put the w1, w2, w3, w4 with units of measurement, then I removed them so I can plot Bode plot, but it seems that Mathcad Prime doesn't want to simplify properly.
Then:
Well, then how to do to display Bode plot in another way?
The idea is that I have units of measurement to the components used (like above w1, w2, w3, w4) and then those components put them in a function of s (like above Gtest(s)) and then I want to display Bode plot for this function in Mathcad Prime 7. In Mathcad15 you didn't have that much trouble if you wanted to do that.
- Mark as New
- Bookmark
- Subscribe
- Mute
- Subscribe to RSS Feed
- Permalink
- Notify Moderator
Oh yes, thats "funny". Prime's symbolic is confusing unit second with variable s.
But here PTC provides a cure. This very often does NOT help with using units and symbolics, but in your case it does - at least partially! You have to turn on the option "Using Units and Constants in Symbolic" in the Calculation Options:
Then you must define your function G.test not dependent on "s" (there is no "s" in the final substituted expression) but rather make it a function of "omega". And because the symbolic still has its problems you have to take care that ALL occurrences of the variable "s" are labelled the very same. Most of your "s" are already labelled as "Variable" and it was only necessary to manually label the "s" in the substitute modifier:
Its not necessary to manually make the conversion from rad to degree when you define Phase. Simply let the unit placeholder in the plot do the job!
Its also not necessary to make omega.1, etc. unitless. Using units should be one of the most benefits when using Prime. You also should apply the proper unit (Hz) to the vector "freq".
Also I guess you should use a log scale on the abscissa in the plots and maybe use "freq" on the abscissa instead of "omega".
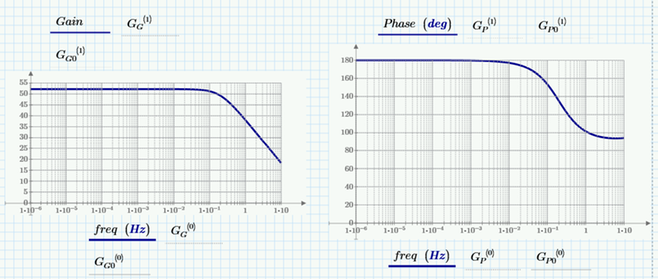
According NOT making "Gain" and "Phase" functions - just look at the picture in my previous post. I also did it here so you may look at the attached worksheet as well.
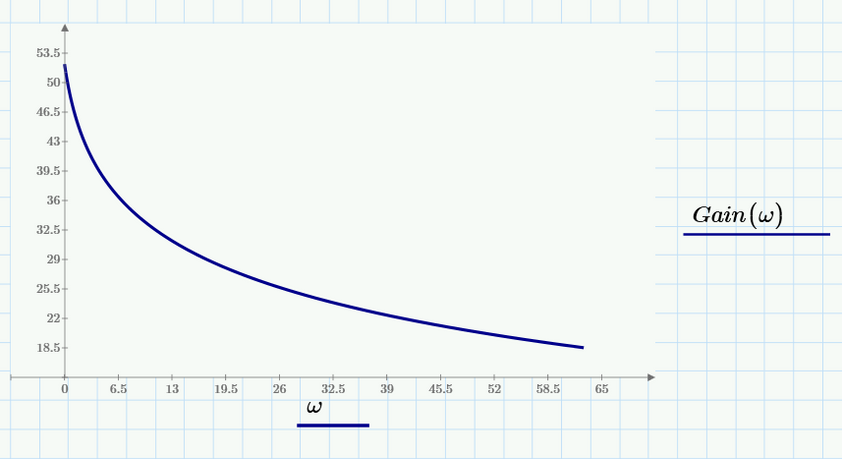
"logspace" creates a vector (not a range) and so omega is a vector, too. "Gain" (no function, just a variable) is now calculated from the vector omega by using vectorization. That way "Gain" is a vector, too. So the plots simply plot one vector over the other instead of a function over a range or vector.
- Mark as New
- Bookmark
- Subscribe
- Mute
- Subscribe to RSS Feed
- Permalink
- Notify Moderator
- Mark as New
- Bookmark
- Subscribe
- Mute
- Subscribe to RSS Feed
- Permalink
- Notify Moderator
Thanks for your answers so far.
It seems, at least so far from what I see, that it must be pressed = to display the adequate results after we have divided with those units of measurement to destroy the units of measurement respectively.
To
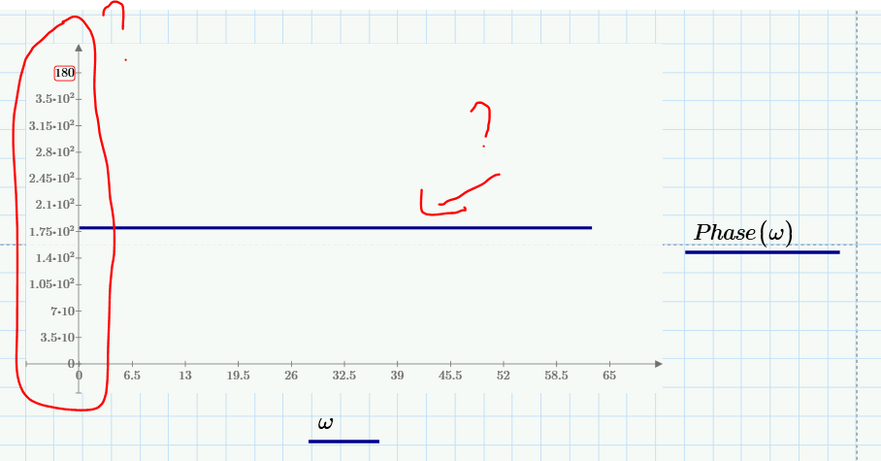
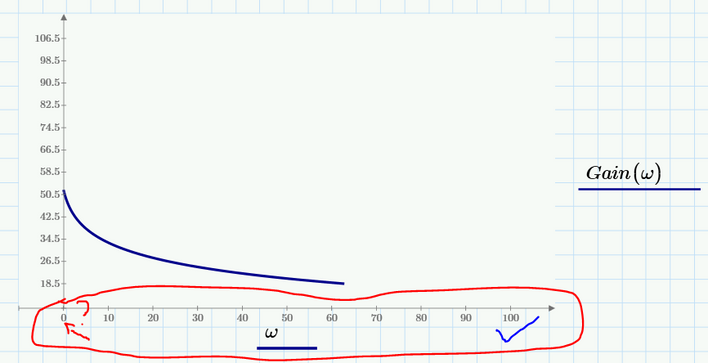
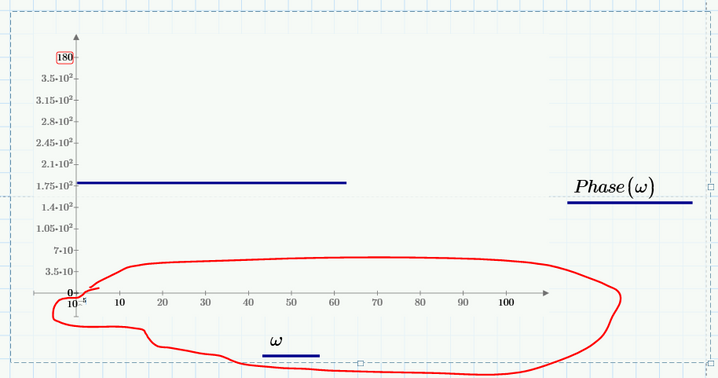
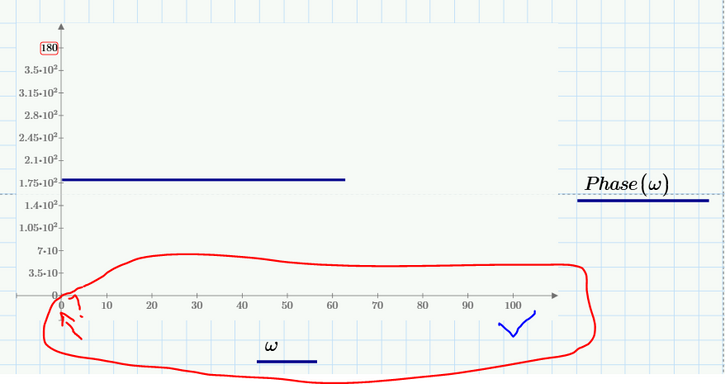
Now the new problem is why I can not change the values on the Y axis (see the below red circle) of the Phase plot graph, and why Phase plot is not displayed properly, from what it seems. Gain plot is fine, according to and with the previous results posted by you.
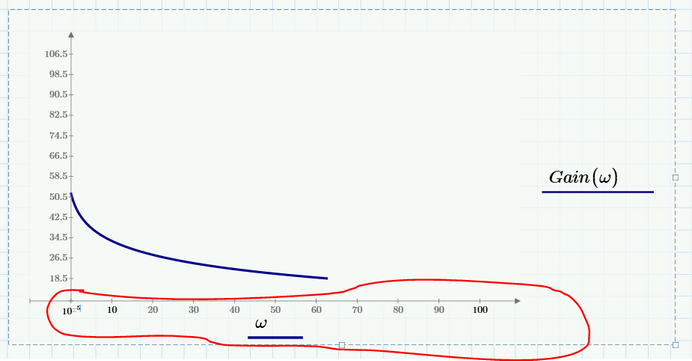
And why I can not display in the both graphs, Gain plot & Phase plot, the starting value for X axis from as much as I want, for example not to start from 0 Hz (rad/s) but from 10 ^-5 Hz (rad/s) (the graph seems to start at the value 0 even if I change the value). The end value of the graph I see that I can change, i.e. if I change from 65 Hz (rad/s) to 100 Hz (rad/s) then the graphs are expanded up to 100 Hz (rad/s), and that is fine, but for the beginning value of the graph even if I change the value from 0 Hz (rad/s) to 10^-5 Hz (rad/s) then the graphs starts all from 0 Hz (rad/s). Why?
Thank you.
- Mark as New
- Bookmark
- Subscribe
- Mute
- Subscribe to RSS Feed
- Permalink
- Notify Moderator
- Mark as New
- Bookmark
- Subscribe
- Mute
- Subscribe to RSS Feed
- Permalink
- Notify Moderator
- Mark as New
- Bookmark
- Subscribe
- Mute
- Subscribe to RSS Feed
- Permalink
- Notify Moderator
I don't understand why you insist on removing units and use G and freq unit-less. Being able to use units in our calculations is one of the strengths of Prime. I also think that its not a good idea to turn angle value into degree by multiplication with 180/pi instead of using the unit placeholder to do the job.
Just my 2 Cents worth, haven't looked in your sheet as I guess/hope that ttokoro already provided solutions for your new problems.
- Mark as New
- Bookmark
- Subscribe
- Mute
- Subscribe to RSS Feed
- Permalink
- Notify Moderator
- Mark as New
- Bookmark
- Subscribe
- Mute
- Subscribe to RSS Feed
- Permalink
- Notify Moderator
Case 1 - OK
Case 2 - NOT OK because of that error: "Unknown error"
Case 3 - NOT OK because of: "These units are not compatible". And if the units had been compatible even in this case, then where would I have been sure that the multiplications/computations for s, w, i and the numbers are doing well, and would not appear some error as in case 2 or the calculations of the numbers in the expression will be not ok?
Thank you.
Mathcad Prime 7 attached.
- Mark as New
- Bookmark
- Subscribe
- Mute
- Subscribe to RSS Feed
- Permalink
- Notify Moderator
ad Case 2: You found a bug in the "new" symbolic engine. You may consider reporting it to PTC support.
Here is what the legacy symbolic engine (available up to Prime 6) returns:
Maybe someone here with Prime 8 can check if the bug still is present in the current version.
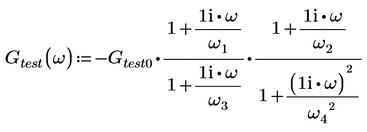
ad Case 3: Prime is perfectly correct about the unit mismatch. Look at the expression here:
The first summand 1 is dimensionless but the second is of dimension time^-1
squaring omega.4 corrects this but because of the bug in the symbolics it only works in Prime6 when we switch back to the old symbolic engine.
- Mark as New
- Bookmark
- Subscribe
- Mute
- Subscribe to RSS Feed
- Permalink
- Notify Moderator
As I see it you have three options to work around that bug in the symbolic engine:
1) Do the substitution manually yourself by defining the function with omega instead of s.
Don't be tempted to use the symbolic "simplify" here as this again would invoke the bug. But you can use a symbolic evaluation with "factor" or "expand" which does not invoke the bug (crazy!).
2) Do not use units. I tried and it worked OK. But this definitely is not the recommended option.
3) Make the symbolic operation before you define your variables and redefine the function later. I would go for this option.
- Mark as New
- Bookmark
- Subscribe
- Mute
- Subscribe to RSS Feed
- Permalink
- Notify Moderator
I played around and traced back the bug up to a very simple example.
The first factor must be a float number (hence 1.0 and not simply 1)
The second one can be any unit. In the example I used inch, in your sheet it was the seconds
The third factor can be any variable.
The bug shows up only when the exponents of the unit and the variable are equal and if its an odd number greater than 1.
Maybe this helps if you are about to report the bug.

