Community Tip - Did you get an answer that solved your problem? Please mark it as an Accepted Solution so others with the same problem can find the answer easily. X
- Subscribe to RSS Feed
- Mark Topic as New
- Mark Topic as Read
- Float this Topic for Current User
- Bookmark
- Subscribe
- Mute
- Printer Friendly Page
Contour plot
- Mark as New
- Bookmark
- Subscribe
- Mute
- Subscribe to RSS Feed
- Permalink
- Notify Moderator
Contour plot
Hi, is there any chance for me to make contour plot which will look the same as the A-B plot I sent you, but I want that the greater the value of member of array C for designated position is, the color of point for that position would be closer to red (classic contour plot with rainbow colors).
Best regards and thanks in advance.
Solved! Go to Solution.
- Labels:
-
Mathcad Usage
Accepted Solutions
- Mark as New
- Bookmark
- Subscribe
- Mute
- Subscribe to RSS Feed
- Permalink
- Notify Moderator
A contour plot is for surfaces only and the lines you would see are those of equal height (and equal color).
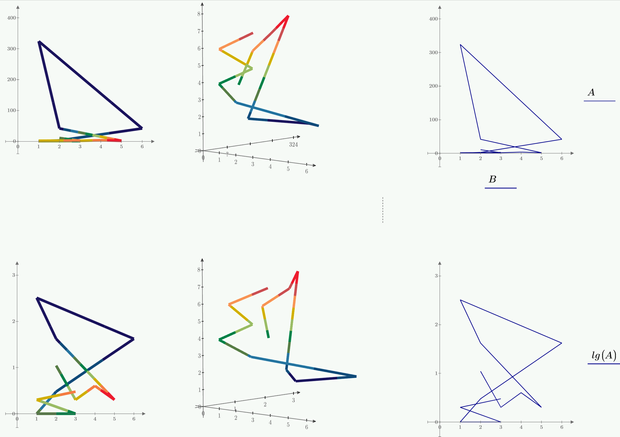
In real Mathcad (MC15 and below) you could create a 3D-plot, chose for color one of the predefined colormaps like "Rainbow" or provide your own color map and arrange the plot so you have a view exactly from above:
The rightmost pic shows a logarithmically scaled y-axis which seemed to me more appropriate for the given data.
But the possibilities in Prime are much more meager and especially when it comes to 3D plots this software is a mess. Actually you could do in Prime what I have shown in the picture, but it would be quite a hassle to get the correct view from above because you would have to fiddle around with the mouse instead of being able to set the view numerically (rotation, tilt, twist and zoom) as in Mathcad. Moreover Prime only allows solid colors and so the wished for effect can't be accomplished.
I actually see no easy way to create in Prime the plot colored the way you demand.
A (sure too much) elaborate possibility would be to generate an appropriate image matrix with a Mathcad program (probably working, but not completely serious meant). You would have to program yourself something like a Bresenham algorithm for plotting lines. And since Prime, unlike real Mathcad, doesn't even provide an image operator, you would not even be able to see the image right away, but would have to save it to a file first and then manually import it back into the Prime file as a picture. Undoubtedly, all in all, far too much effort.
- Mark as New
- Bookmark
- Subscribe
- Mute
- Subscribe to RSS Feed
- Permalink
- Notify Moderator


- Mark as New
- Bookmark
- Subscribe
- Mute
- Subscribe to RSS Feed
- Permalink
- Notify Moderator
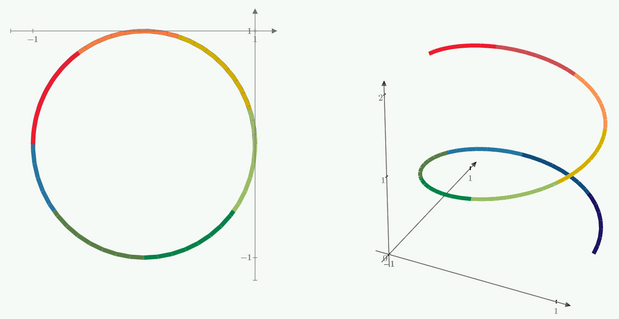
Or that way
But it's a shame that we have to resort to tedious and inadequate workarounds just because the software is so inferior and doesn't provide elementary features even after about 15 years of "development".


