Community Tip - You can subscribe to a forum, label or individual post and receive email notifications when someone posts a new topic or reply. Learn more! X
- Subscribe to RSS Feed
- Mark Topic as New
- Mark Topic as Read
- Float this Topic for Current User
- Bookmark
- Subscribe
- Mute
- Printer Friendly Page
Difficulty in defining when the first deflection takes place in a plot
- Mark as New
- Bookmark
- Subscribe
- Mute
- Subscribe to RSS Feed
- Permalink
- Notify Moderator
Difficulty in defining when the first deflection takes place in a plot
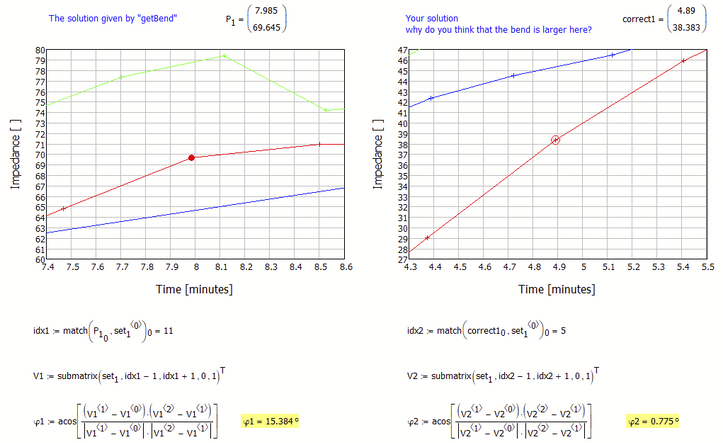
Years ago Werner helped me in setting up a technique to define the first deflection in a curve. Now I have to make a similar analysis but unfortunately the worksheet miscalculates the first deflection in 5 out of 6 plots. I was wondering whether this could be optimized? I have tried a few approaches e.g. using a higher derivative but this only marginally improved my results. I have put the correct indexes in the worksheet as correct 1 etc. Any help or suggestion to improve the method would be extremely appreciated as I have to analyse 150 plots and would like to avoid doing this manually.
Thank you in advance!
- Labels:
-
Other
- Mark as New
- Bookmark
- Subscribe
- Mute
- Subscribe to RSS Feed
- Permalink
- Notify Moderator
How did you (independently from Werner's routine) determine the maxBend points?
With respect to set.1 you say the maxBend occurs at x=4.89 (rather than at 7.99).
Are you looking for maximum of the slope (1st derivative, I find it at about x=4.4) or maximum of the bend (2nd derivative, I find it at about x=3.3)?
Luc
- Tags:
- you determine
- Mark as New
- Bookmark
- Subscribe
- Mute
- Subscribe to RSS Feed
- Permalink
- Notify Moderator
Dear Luc, thank you for your reply. As you probably noted the first part of the curve is of no interest (all impedance values below 20. What I am looking for is when the upgoing curve starts to deviate towards the right. Your proposed 4.9 value is correct. I obtained the "correct" values by visual judgement as I did not succeeded in finding a better method.
- Mark as New
- Bookmark
- Subscribe
- Mute
- Subscribe to RSS Feed
- Permalink
- Notify Moderator
Filip,
My proposed value is not 4.9, that's your result. I get 4.4 for the maximum of the first derivative, 3.3 for the maximum of the 2nd derivative.
Luc
- Mark as New
- Bookmark
- Subscribe
- Mute
- Subscribe to RSS Feed
- Permalink
- Notify Moderator
You are right that was my mistake, but for that curve your 4.4 should be close although I would have judged it somewhat higher.
- Mark as New
- Bookmark
- Subscribe
- Mute
- Subscribe to RSS Feed
- Permalink
- Notify Moderator
Can you state more clearly and in detail how you would define "greatest bend" or "where its bending to the right"?
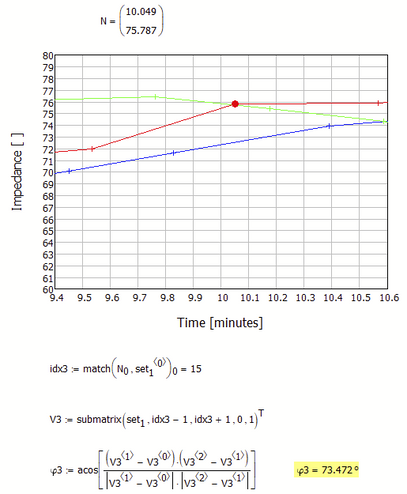
At about 10 there is an even larger bend:
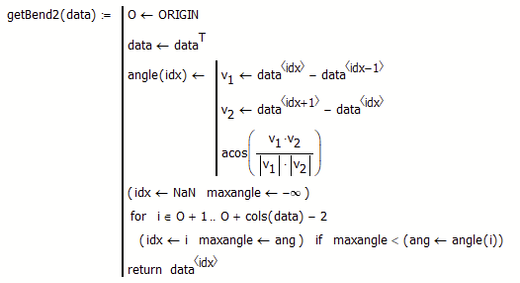
The position with the maximum angle between two line segments can be obtained by this function:
- Mark as New
- Bookmark
- Subscribe
- Mute
- Subscribe to RSS Feed
- Permalink
- Notify Moderator
Werner and Luc thank you both so much for looking at my problem. Maybe I should give some more information. The graphs represent the blood clotting process. The horizontal start represents the liquid phase of the blood before clotting starts that is the reason why it is not so important. The initial rise represents the rapid interaction of coagulation factors. Once the initial clot is formed, the blood platelets which are connected to the blood proteins starts to pull at these proteins thus making the clot more dense. The latter is represent in the graphs by a deviation to the right. So the degree of deviation will in part depend on the functionality of the blood platelets which makes it difficult to start with a given angle. Most ideally the angle should be a variable so that even small deviations can be detected. When you look in my previous worksheet I have visually tried to define the points (correct1, correct2,...). In most cases the deviation will be little to start. So I did not express myself very well by stating that I was looking for the maximum deviation. The right question would be can I define the start of platelet contraction in an automated way. Thanks again for your time.
- Mark as New
- Bookmark
- Subscribe
- Mute
- Subscribe to RSS Feed
- Permalink
- Notify Moderator
Try this:
It gives you the first point after the first top of the slope.
Success!
Luc
- Mark as New
- Bookmark
- Subscribe
- Mute
- Subscribe to RSS Feed
- Permalink
- Notify Moderator
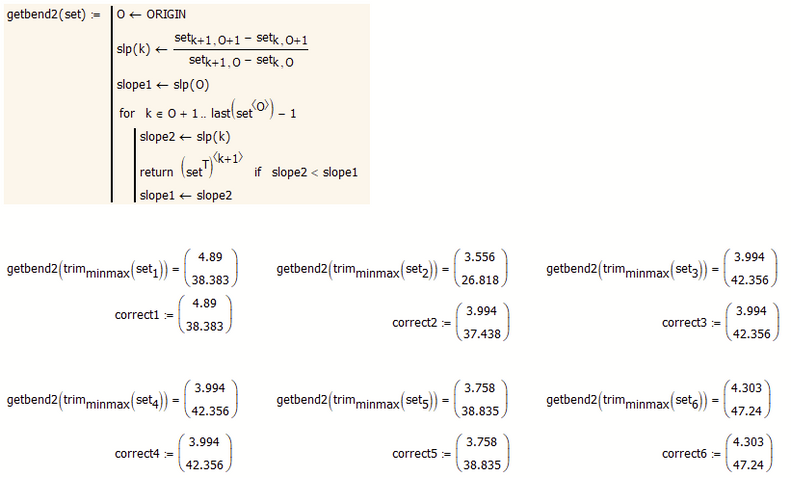
Here is a function which gives you the values you had manually selected:
- Mark as New
- Bookmark
- Subscribe
- Mute
- Subscribe to RSS Feed
- Permalink
- Notify Moderator
Dear Luc and Werner, thank you both for your solution. I have played a bit with both of them over the last days but unfortunately they both have advantages and disadvantages. I would judge Luc's solution slightly superior to Werner's. Would smoothing the data help to obtain better results (de first deviation in the upstroke) or is this just the best we can get with this type of data sets?
- Mark as New
- Bookmark
- Subscribe
- Mute
- Subscribe to RSS Feed
- Permalink
- Notify Moderator
Would smoothing the data help to obtain better results (de first deviation in the upstroke)
I guess that this depends on giving a crisp clear definition of what the goal exactly is, so one can decide whats "good" or "bad" and whats "better".
My last solution doesn't use a derivative but just bases on the slope of the single line segments between the given points (and of course you may call this sort of the first derivative). The routine simply tries to catch the position, when this slope changes from increasing to decreasing and you may chose for the position the start point of the segment with the lower slope or the end point. Of course this is similiar to look for a sign change (or the point of zero= of the second derivative.
Using derivatives you must be aware that you can't add information by any math calculation which simply isn't there, given the measured data. In my first solutions in this thread I provided two slightly different routines for the derivative of that kind of "curve" - both basically use some kind of mean value derived from the slopes of the adjacent line segments. This may give a good result for one data set and a not so good one for the other. The same of course applies to my last approach, too, which simple compares the slope the current line segment with the one of its predecessor.
So I guess you either have to define more clearly and in detail the specific position you are looking for, providing also examples which show, where a specific method doesn't deliver the desired result and also state WHY a different solution is "better".
Otherwise I think you would have to settle with the method which gives the better results for the majority of your test data. If this is Lucs approach using the derivatives, keep in mind that different algorithms for calculating the "discrete" derivative might give different results.
Similarily smoothing (there are also many different ways of doing so) might give "better" (based on whatever definition you provide) results for one set of data but nor for the next one.


