Community Tip - Did you know you can set a signature that will be added to all your posts? Set it here! X
- Subscribe to RSS Feed
- Mark Topic as New
- Mark Topic as Read
- Float this Topic for Current User
- Bookmark
- Subscribe
- Mute
- Printer Friendly Page
Fourier series example problem
- Mark as New
- Bookmark
- Subscribe
- Mute
- Subscribe to RSS Feed
- Permalink
- Notify Moderator
Fourier series example problem
Good day.
I was hoping you could help me with my assignment on programming a fourier series analysis.
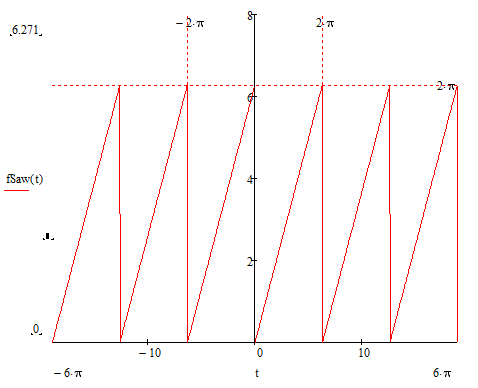
Can someone teach me how to graph this on mathcad prime? I need to find the function that will replicate the attached file below.
Your help would be much appreciated, since I am still learning from this software.
Thank you in advance and God Bless.
Solved! Go to Solution.
Accepted Solutions
- Mark as New
- Bookmark
- Subscribe
- Mute
- Subscribe to RSS Feed
- Permalink
- Notify Moderator
- Tags:
- Prime 7.0
- Mark as New
- Bookmark
- Subscribe
- Mute
- Subscribe to RSS Feed
- Permalink
- Notify Moderator
We'd love to help!
Please attach your Mathcad file so we can see what you have so far.
- Mark as New
- Bookmark
- Subscribe
- Mute
- Subscribe to RSS Feed
- Permalink
- Notify Moderator
In the attached file you will find everything required and more.
- Mark as New
- Bookmark
- Subscribe
- Mute
- Subscribe to RSS Feed
- Permalink
- Notify Moderator
This examples would surely help me a lot in my future references. I am still learning a lot from this software. My professor introduced me to mathcad last 3 months and I am still trying to explore these things.
I really appreciate your response for helping me.
Thank you.
- Mark as New
- Bookmark
- Subscribe
- Mute
- Subscribe to RSS Feed
- Permalink
- Notify Moderator
On the graphing stage, I do not have any idea on how I would graph it, but here is my file on my fourier series exam.
- Mark as New
- Bookmark
- Subscribe
- Mute
- Subscribe to RSS Feed
- Permalink
- Notify Moderator
- Mark as New
- Bookmark
- Subscribe
- Mute
- Subscribe to RSS Feed
- Permalink
- Notify Moderator
- Mark as New
- Bookmark
- Subscribe
- Mute
- Subscribe to RSS Feed
- Permalink
- Notify Moderator
Nice,
but, how would you proceed if you had to extend it from -100, 100...
There's a handy mathematical function, also available in Prime, that allows you to convert a running variable (like t is) to a short sequence..
It is somewhat related to division. I'll spoil your assignment no further.
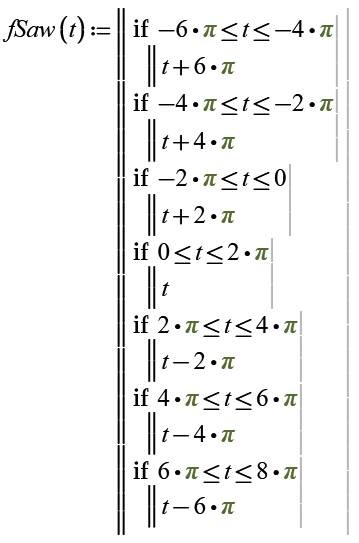
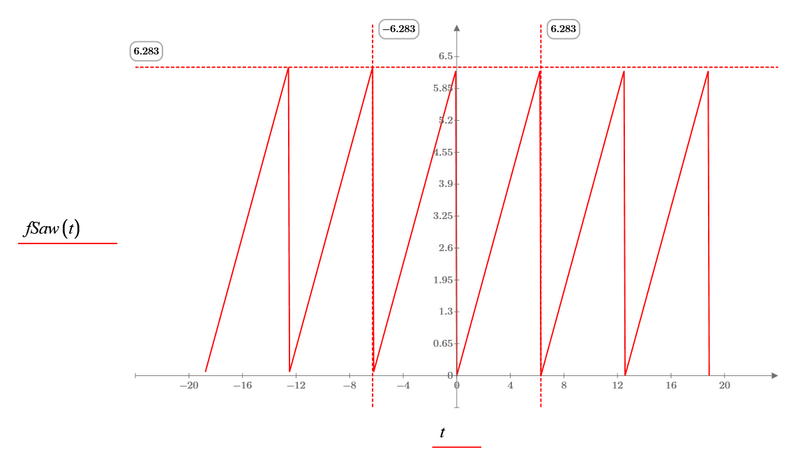
Anyway, here is the result:
Success!
Luc
- Mark as New
- Bookmark
- Subscribe
- Mute
- Subscribe to RSS Feed
- Permalink
- Notify Moderator
Spoil me more, please. I am badly running out of time for my problem set. I really appreciate you for helping me out.
- Tags:
- please.
- Mark as New
- Bookmark
- Subscribe
- Mute
- Subscribe to RSS Feed
- Permalink
- Notify Moderator
How can I use this if I want an infinite number of expansion? like if I use a multiple number of expression "n" so it will not be limited to 6pi?
I really appreciate your response for helping me.
Thank you.
- Mark as New
- Bookmark
- Subscribe
- Mute
- Subscribe to RSS Feed
- Permalink
- Notify Moderator
Can I ask for a lower version of your mathcad prime? I can't open it. Thank you.
- Mark as New
- Bookmark
- Subscribe
- Mute
- Subscribe to RSS Feed
- Permalink
- Notify Moderator
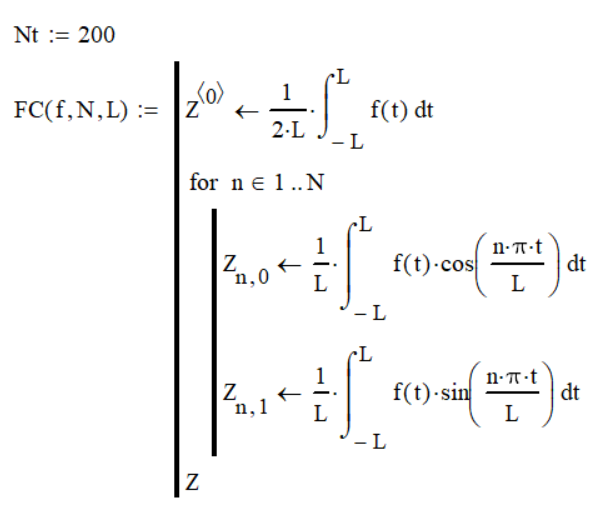
From the help of Mathcad programming.
- Tags:
- Prime 7.0
- Mark as New
- Bookmark
- Subscribe
- Mute
- Subscribe to RSS Feed
- Permalink
- Notify Moderator
Can i verify the variables that you used?
N is the maximum number of expansion
L is the number of period
Z is the final value of the series.
If possible, elaborate it for me. Thank you so much.
- Mark as New
- Bookmark
- Subscribe
- Mute
- Subscribe to RSS Feed
- Permalink
- Notify Moderator
N is the maximum number of expansion: Yes.
L is the number of period : L is the 1/2 of the period of the fundamental waveform, in your case L=2*pi.
Z is the final value of the series. : Yes Real and Imaginary indexes from o to N.
- Tags:
- Electric_circuit
- Mark as New
- Bookmark
- Subscribe
- Mute
- Subscribe to RSS Feed
- Permalink
- Notify Moderator
I'm so amazed on how you can think of such programs.
I need to study more.
do you mind if I ask one more? what does res() does, and on the 3 variables on the functions that you gave (FC(f,N,L), can you explain them? What does the first, 2nd and 3rd variable does to the whole program.
I am having a hard time exploring this software. I hope you can enlighten me so I can use this on my research in the future.
- Mark as New
- Bookmark
- Subscribe
- Mute
- Subscribe to RSS Feed
- Permalink
- Notify Moderator
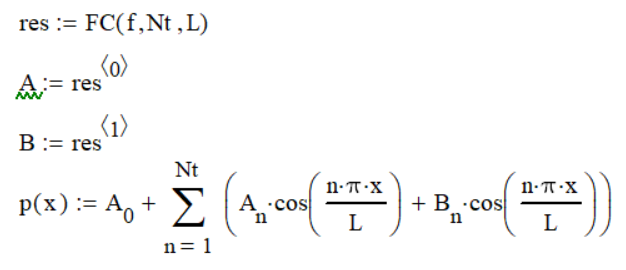
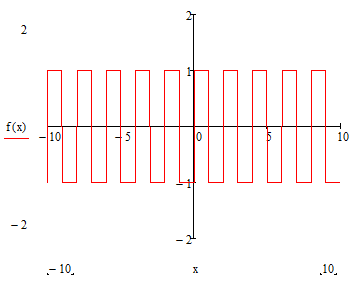
I want to implement your variant for a square wave signal.
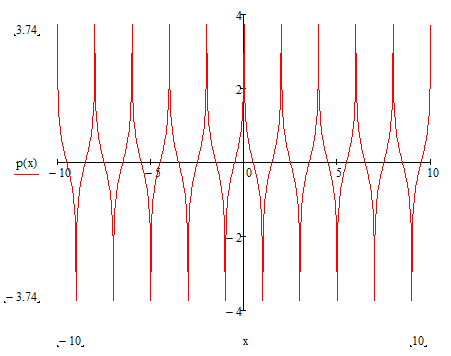
What is wrong with my implementation of your variant for a square wave?
What I am doing wrong?
- Mark as New
- Bookmark
- Subscribe
- Mute
- Subscribe to RSS Feed
- Permalink
- Notify Moderator
'It's a sin'...
In your definition of p(x) you've got cos in both terms under the sum.
The second should be sin
Success!
Luc
- Mark as New
- Bookmark
- Subscribe
- Mute
- Subscribe to RSS Feed
- Permalink
- Notify Moderator
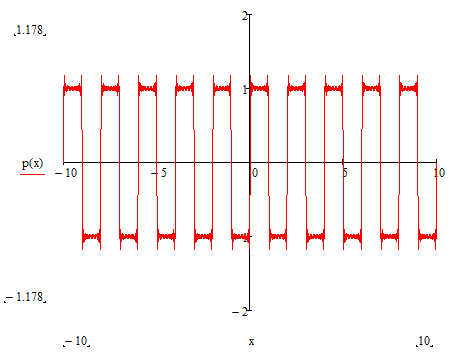
Ah...
Yes, it works now...after correction.
Thank you for your remark and sight.
- Mark as New
- Bookmark
- Subscribe
- Mute
- Subscribe to RSS Feed
- Permalink
- Notify Moderator
@ttokoro, @LucMeekes, @-MFra-. @Fred_Kohlhepp, @Teddy
It would be interesting and nice, for those who want and have time, of course, to add other graphs in this topic (besides the one in the sawtooth and square wave signals), that can be used with @ttokoro functions to generate such graphs and calculate the corresponding Fourier series.
- Mark as New
- Bookmark
- Subscribe
- Mute
- Subscribe to RSS Feed
- Permalink
- Notify Moderator
Some time ago, I published in the community a collection of periodic signals (there are one or two signals to correct), about forty, if I am not mistaken. You have to search for all the content.
- Mark as New
- Bookmark
- Subscribe
- Mute
- Subscribe to RSS Feed
- Permalink
- Notify Moderator
You can use an even simpler function (no programming required, works also in Prime Express) to calculate the Fourier coefficients of a periodic function:
As an example, take a square wave as a function of t, with period T, offset O and amplitude A:
e.g.:
Define:
Calculate the Fourier coefficients:
(Note that Re and Im are Premium functions, they do not work in Express,
but they can be easily built with:
)
Now you can build the Fourier representation with either one of:
The first uses the A and B vectors and the sine and cosine functions. The second uses the array C with complex values.
The results are:
I've offset the Fes(t) function by 0.2 to be able to see it alongside Fs(t)
You can cut it short in a single function now, defined as:
Example for a triangle:
Last example:
Now it's up to your imagination regarding periodic functions.
Success!
Luc
- Mark as New
- Bookmark
- Subscribe
- Mute
- Subscribe to RSS Feed
- Permalink
- Notify Moderator
@LucMeekes, @ttokoro, @Fred_Kohlhepp, @-MFra-, @Teddy
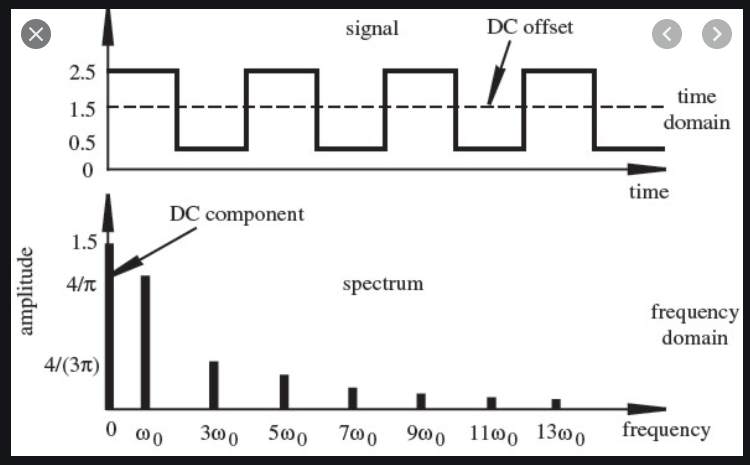
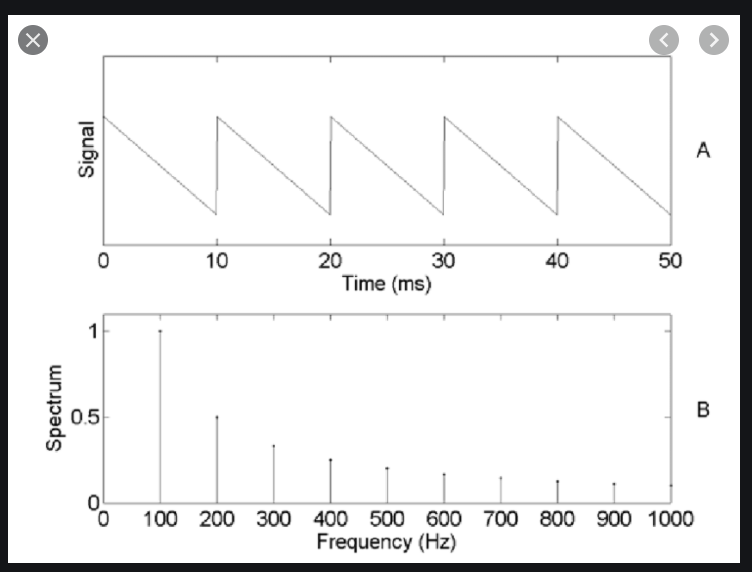
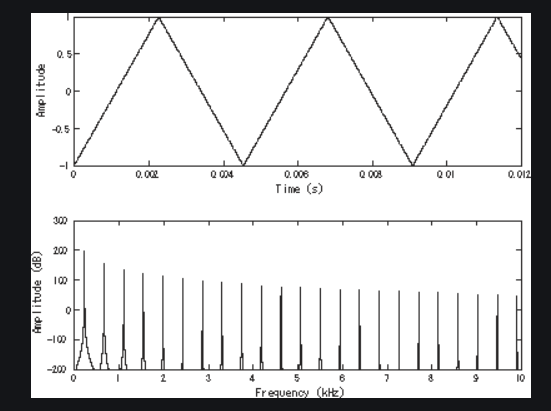
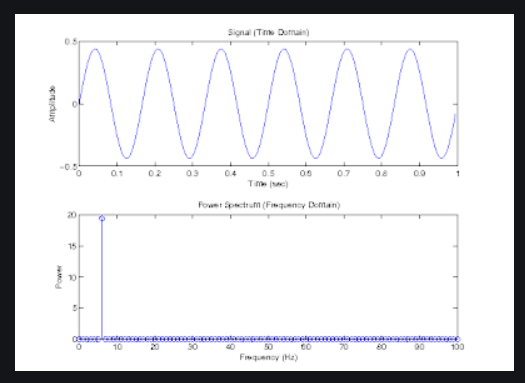
How can achieve the Fourier spectrum for these kinds of signals that were derived in this topic?
For example:
These images are an example to show you the idea.
I think you know what it is all about ... the Fourier spectrum of a signal.
The spectrum does not necessarily have to be performed for the signals in the image, but for those that have been deduced in this topic, but it is also possible for these of course.
But as much as possible to use @ttokoro functions.
- Mark as New
- Bookmark
- Subscribe
- Mute
- Subscribe to RSS Feed
- Permalink
- Notify Moderator
To create a spectrum from data, use the dft() function. It is built into Prime.
Be sure to consult the online help and view the examples provided by Prime.
Success!
Luc
- Mark as New
- Bookmark
- Subscribe
- Mute
- Subscribe to RSS Feed
- Permalink
- Notify Moderator
What do you mean by creating a spectrum from data? is this the same as the spectral acceleration of any earthquakes?
- Mark as New
- Bookmark
- Subscribe
- Mute
- Subscribe to RSS Feed
- Permalink
- Notify Moderator
A Fourier transform takes the time history of a measurement and "transforms" it to display information (magnitude and phase) against frequency. This information is sometimes called the frequency spectrum. If you have the spectrum of an earthquake, the magnitude and phase of the frequencies of an accelerometer, you could recreate the time history of the earthquake.
That would be one example.
- Mark as New
- Bookmark
- Subscribe
- Mute
- Subscribe to RSS Feed
- Permalink
- Notify Moderator


- Tags:
- Electric_circuit
- Mark as New
- Bookmark
- Subscribe
- Mute
- Subscribe to RSS Feed
- Permalink
- Notify Moderator
Can you put a Mathcad file with these things?
- Mark as New
- Bookmark
- Subscribe
- Mute
- Subscribe to RSS Feed
- Permalink
- Notify Moderator
you can use "Writeprn (" Destination file "," Origin file ")
- Mark as New
- Bookmark
- Subscribe
- Mute
- Subscribe to RSS Feed
- Permalink
- Notify Moderator
- Tags:
- Electric_circuit
- Mark as New
- Bookmark
- Subscribe
- Mute
- Subscribe to RSS Feed
- Permalink
- Notify Moderator
- Tags:
- Electric_circuit


