Community Tip - You can change your system assigned username to something more personal in your community settings. X
- Subscribe to RSS Feed
- Mark Topic as New
- Mark Topic as Read
- Float this Topic for Current User
- Bookmark
- Subscribe
- Mute
- Printer Friendly Page
Phase Plane plot for ODE's
- Mark as New
- Bookmark
- Subscribe
- Mute
- Subscribe to RSS Feed
- Permalink
- Notify Moderator
Phase Plane plot for ODE's
I am solving a system of ODE's. Solutions look good (I am checking against plots in a book) except when I plot two of the output functions against each other to get a phase plane plot. Changing range of axes does not seem to help. Range of axes does not correspond to range for the individual functions. What am I missing?
- Mark as New
- Bookmark
- Subscribe
- Mute
- Subscribe to RSS Feed
- Permalink
- Notify Moderator
Hi Jhon.
Plot over a range variable like tt := 0,0.1..1000.
For better accurate results, can check the help and the quicksheet about the function statespace(init, t1, t2, intvls, A, [B], [u])
Best regards.
Alvaro.
- Mark as New
- Bookmark
- Subscribe
- Mute
- Subscribe to RSS Feed
- Permalink
- Notify Moderator
Hi.
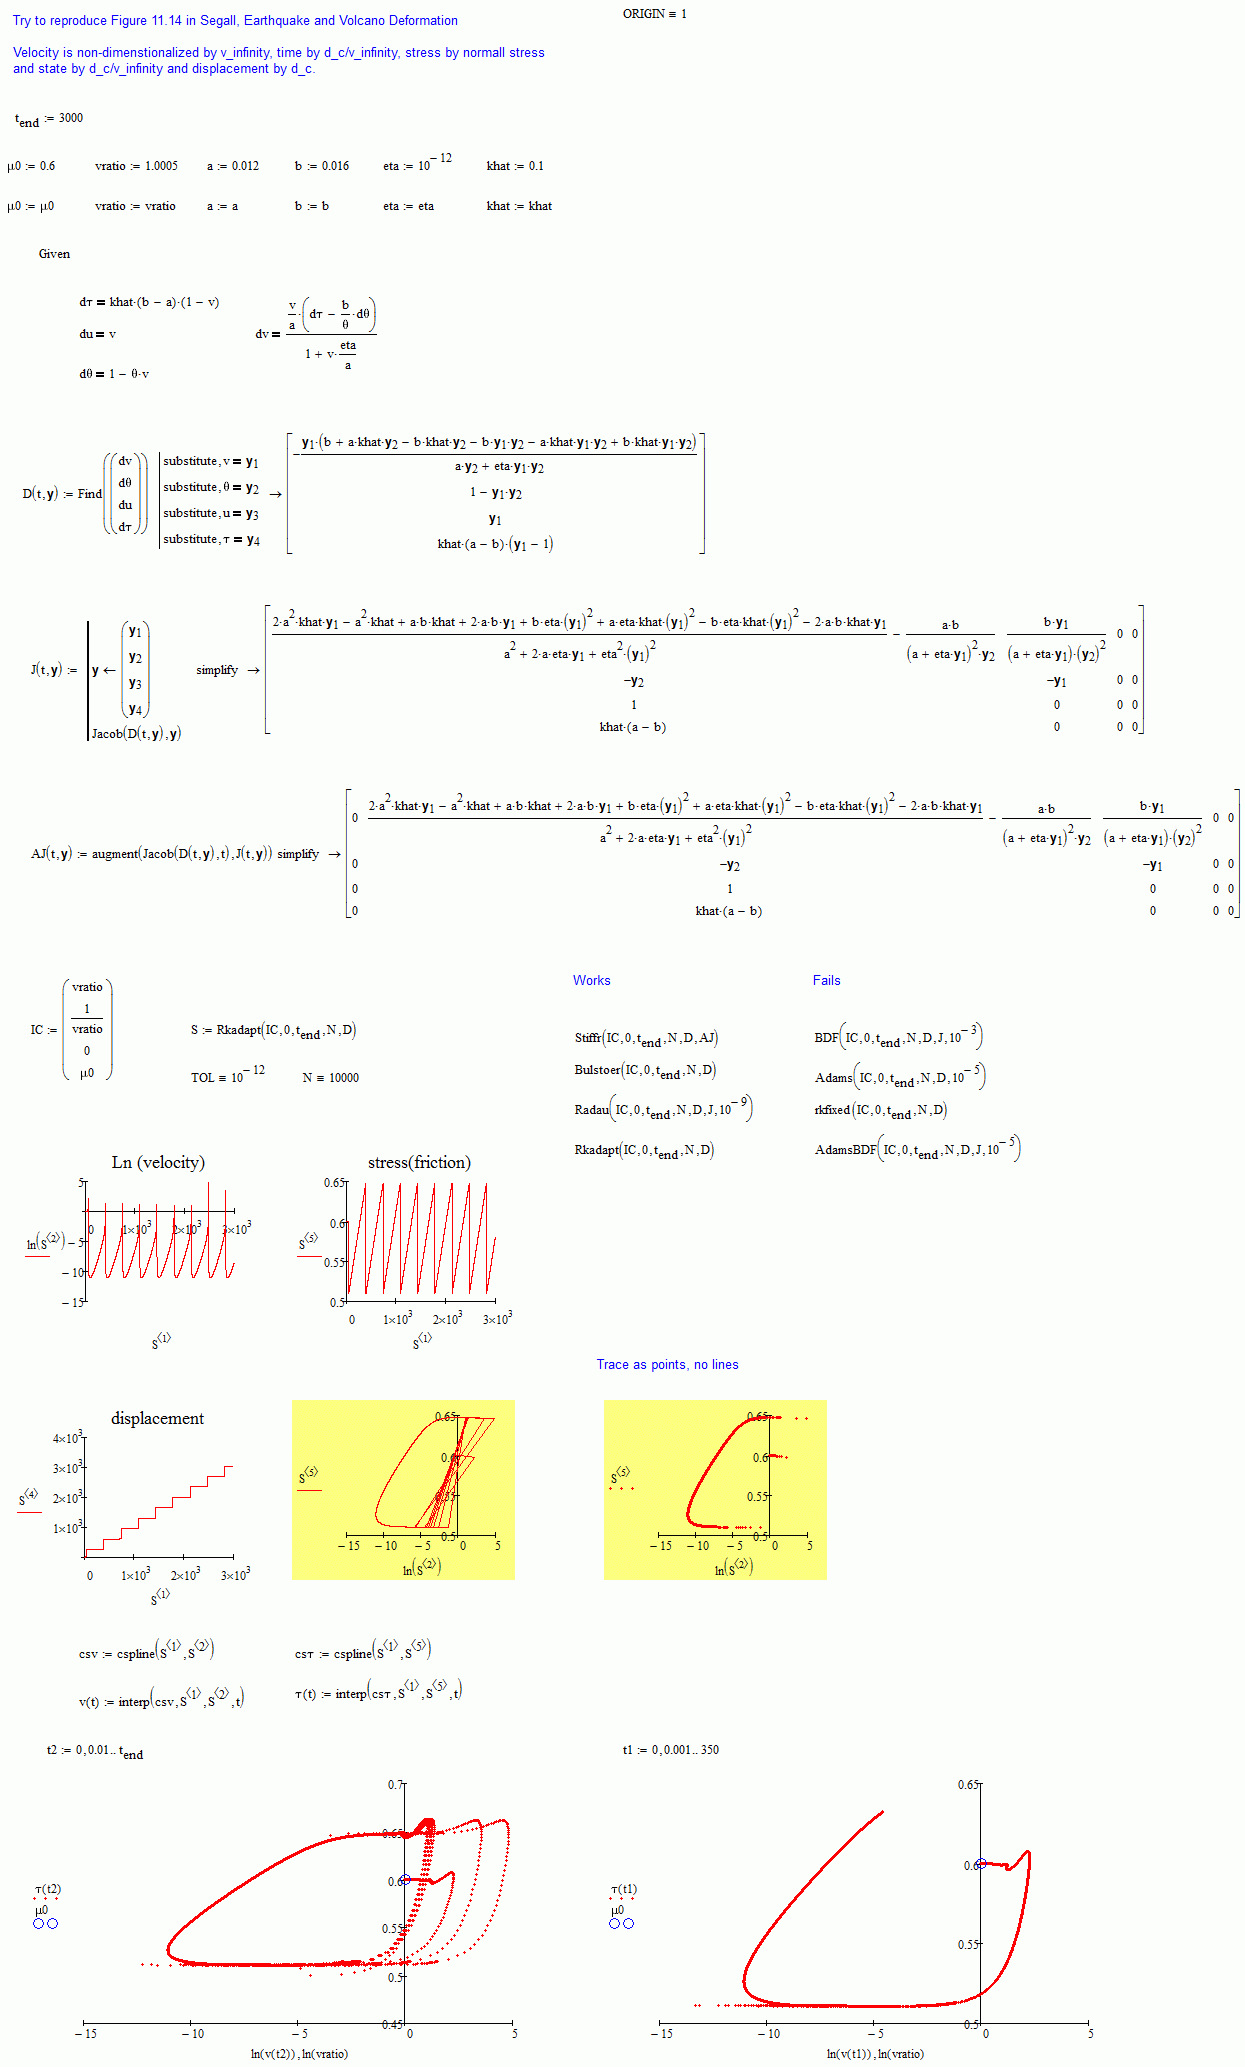
In the attached, the implementation for call Rkadapt, and some few comments.
Best regards.
Alvaro.
- Mark as New
- Bookmark
- Subscribe
- Mute
- Subscribe to RSS Feed
- Permalink
- Notify Moderator
Thanks Alvaro.
As far as I could tell, statespace only works for linear equations. But just plotting points for a range variable over a narrower range of time worked pretty well.
I had a few, probably elementary, questions on your worksheet. I have only used the symbolic manipulator in the simplest of cases. How did you actually enter you expression for the substitution; specifically the multiple line part? I could not see how to do it on my own.
Why did you use Rkadapt directly instead of Odesolve? I used to use the direct calls to the ode solvers but once I learned Odesolve, it seemed easier.
Thanks again.
John
- Mark as New
- Bookmark
- Subscribe
- Mute
- Subscribe to RSS Feed
- Permalink
- Notify Moderator
Hi John.
As far as I could tell, statespace only works for linear equations. But just plotting points for a range variable over a narrower range of time worked pretty well.
Yes, you're right, my mistake. I don't the equations as system when wrote that.
But just plotting points for a range variable over a narrower range of time worked pretty well.
Yes, but with the appointments that Richard do about interpolation and ranges.
Why did you use Rkadapt directly instead of Odesolve? I used to use the direct calls to the ode solvers but once I learned Odesolve, it seemed easier.
Because it is supposed that with the solvers you have more control for complicated systems (in the numerical sense). In the attached, the Jacobian and the augmented jacobian matrix for call other solvers. You don't show which is the "correct" picture, so, I assume that it is more accurate than the obtained with odesolve block.
I had a few, probably elementary, questions on your worksheet. I have only used the symbolic manipulator in the simplest of cases. How did you actually enter you expression for the substitution; specifically the multiple line part? I could not see how to do it on my own.
Write the expression, lets says, x, ( * ) then click "substitute" keyword in the symbolic toolbar, press left, left, space, space, and click "substitute" again. Repeat from ( * ) until you get bored.

Best regards.
Alvaro.
PD: Sorry about call you Jhon and not John before, I always confuse this name.

- Mark as New
- Bookmark
- Subscribe
- Mute
- Subscribe to RSS Feed
- Permalink
- Notify Moderator
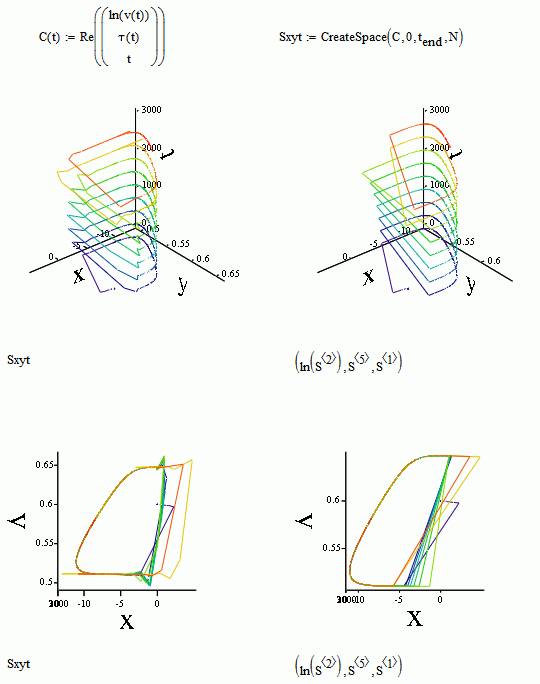
Well, finally, a good view of the system evolution.
Best regards.
Alvaro.

- Mark as New
- Bookmark
- Subscribe
- Mute
- Subscribe to RSS Feed
- Permalink
- Notify Moderator
Those are nice plots ![]() . You still have some "bumps" on the corners of the left hand plots though, which I think are interpolation artifacts.
. You still have some "bumps" on the corners of the left hand plots though, which I think are interpolation artifacts.
- Mark as New
- Bookmark
- Subscribe
- Mute
- Subscribe to RSS Feed
- Permalink
- Notify Moderator
Hi Richard.
Yes, you are very right. I'm just revisiting diff equations, because I need to actualize my old stuff, and forgot a lot of things. I'm trying to use cspliene at any place, and, obviously, it's a bad idea. But what, in this particular problem, can't interpret, is the behavior of the "yellow" part, which is most accurate, in that sense, with cspline. Why, in the "correct" right curve it goes down?
And as usual, you are a gentleman in the way that you pointing mistakes, thanks.
So, left plots are wrongs, where wrong means wrong. Those "bumps" looks like Fourier series distortions (aren't that, just look like that) and are introduced by the unnecessary use (or abuse) the cspline's. But left ones needs some process to make them more accurate, I don't see the physical system doing that. The system is autonomous! (this is, without explicit t in D(t,x)) Can't be that difficult.
Best regards.
Alvaro.
- Mark as New
- Bookmark
- Subscribe
- Mute
- Subscribe to RSS Feed
- Permalink
- Notify Moderator
Alvaro,
Thanks for the help. Even though I have used MC for a long time, I am seeing that I have not been taking advantage of all its capabilities. I will study your worksheets to see what I can learn (but I may have more questions).
Just FYI, the system is meant to model earthquake occurrence: long periods of small velocity (tectonic plate motion) punctuated by very large velocities and rapid drops in stress (earthquakes).
John
P.S. Not problem about John vs. Jhon - I am appreciative of your help.
- Mark as New
- Bookmark
- Subscribe
- Mute
- Subscribe to RSS Feed
- Permalink
- Notify Moderator
The quickplot function is not very reliable. It's better to define a range variable for the independent variable. Note that odesolve calculates the solution at a number of points determined by the fourth argument to the function. To find intermediate values it then interpolates using lspline. This is important, because spline interpolation does not work well for functions that are not smooth, and is even worse for discontinuous functions, as you have. You should therefore match the number of solution points to the number of points in the plot. If you try to plot more points than you solved for what you see are non-valid interpolated points (change the range variable to 0,0.01..1000 to see what I mean).
- Mark as New
- Bookmark
- Subscribe
- Mute
- Subscribe to RSS Feed
- Permalink
- Notify Moderator
Thanks. That made the plot look much better.


