Community Tip - Need to share some code when posting a question or reply? Make sure to use the "Insert code sample" menu option. Learn more! X
- Subscribe to RSS Feed
- Mark Topic as New
- Mark Topic as Read
- Float this Topic for Current User
- Bookmark
- Subscribe
- Mute
- Printer Friendly Page
Plotting Stress Strain Curve
- Mark as New
- Bookmark
- Subscribe
- Mute
- Subscribe to RSS Feed
- Permalink
- Notify Moderator
Plotting Stress Strain Curve
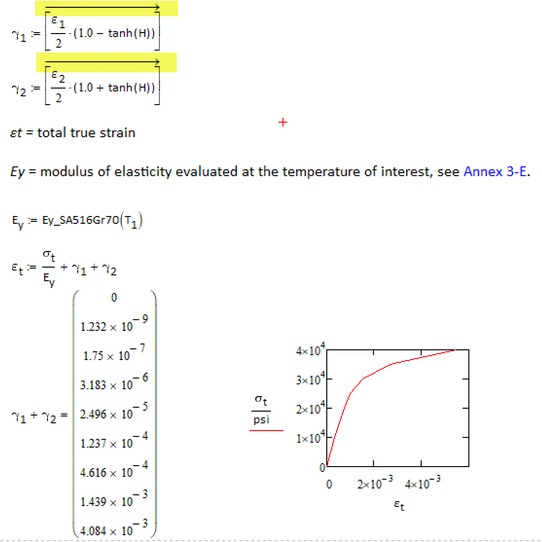
I am trying to plot a stress strain curve using a model but the strain values don't start from zero. wonder if anyone can look at the template attached.
- Labels:
-
Mechanical_Engineering
- Mark as New
- Bookmark
- Subscribe
- Mute
- Subscribe to RSS Feed
- Permalink
- Notify Moderator
Why do you think the plot should start at 0?
The vector epsilon.t start with value 6.137*10^-3 and so does the plot.
- Mark as New
- Bookmark
- Subscribe
- Mute
- Subscribe to RSS Feed
- Permalink
- Notify Moderator
Thanks for the question. Looking at the equation for epsilon.t and sigma t, a value of zero sigma t should yield a value of zero epsilon.t. If I just define sigma t as zero, I am in fact getting epsilon.t as zero as it should be. However when I define a set of values for sigma t from zero, it doesn't give me epsilon.t values starting from zero.
Thanks again for looking into this.
- Mark as New
- Bookmark
- Subscribe
- Mute
- Subscribe to RSS Feed
- Permalink
- Notify Moderator
@Werner_E wrote:
Why do you think the plot should start at 0?
The vector epsilon.t start with value 6.137*10^-3 and so does the plot.
@Werner_E wrote:
Why do you think the plot should start at 0?
The vector epsilon.t start with value 6.137*10^-3 and so does the plot.
Thanks for the question. Looking at the equation for epsilon.t and sigma t, a value of zero sigma t should yield a value of zero epsilon.t. If I just define sigma t as zero, I am in fact getting epsilon.t as zero as it should be. However when I define a set of values for sigma t from zero, it doesn't give me epsilon.t values starting from zero.
Thanks again for looking into this.
- Mark as New
- Bookmark
- Subscribe
- Mute
- Subscribe to RSS Feed
- Permalink
- Notify Moderator
Thanks for the question. Looking at the equation for epsilon.t and sigma t, a value of zero sigma t should yield a value of zero epsilon.t. If I just define sigma t as zero, I am in fact getting epsilon.t as zero as it should be. However when I define a set of values for sigma t from zero, it doesn't give me epsilon.t values starting from zero.
Yes, I see.
The problem is the calculation of gamma1 and gamma2. epsilon_/2 is a vector and (1-tanh(H)) is a vector, too. So the multiplication of the two is interpreted as the scalar product of these vectors and is not done elementwise.
You have to use vectorization to get the result you intended:
BTW, its a good idea to apply vectorization ALWAYS when doing calculations with a vector of input values (unless of course you want real vector operations to be done of course).
An even better approach is to set up the sheet so the calculations are done with single scalar input values only, turn them into functions of the input values and only after that you may use those functions vectorized with vectors as input values.
EDIT: See the next post of mine for an example.
- Mark as New
- Bookmark
- Subscribe
- Mute
- Subscribe to RSS Feed
- Permalink
- Notify Moderator
Just as an afterthought - It may be a better idea to turn your calculations into functions dependent on sigma.t. That way you can avoid the vectorization necessary for plotting, get a smoother curve and have more flexibility for subsequent calculations.
See attached sheet.
- Mark as New
- Bookmark
- Subscribe
- Mute
- Subscribe to RSS Feed
- Permalink
- Notify Moderator
Hi
You do not need the vectorization of the stress interpolation.
Cheers
Terry
- Mark as New
- Bookmark
- Subscribe
- Mute
- Subscribe to RSS Feed
- Permalink
- Notify Moderator
@terryhendicott wrote:
Hi
You do not need the vectorization of the stress interpolation.
Cheers
Terry
Thats correct. I haven't even looked at the calculations after the wrong plot but now I have seen that global assignments (which i don't like and would not recommend) are used.
Fortunately "linterp" seems to ignore the vectorization operator as otherwise it should throw an error if used with vectorization.


