Community Tip - Want the oppurtunity to discuss enhancements to PTC products? Join a working group! X
- Subscribe to RSS Feed
- Mark Topic as New
- Mark Topic as Read
- Float this Topic for Current User
- Bookmark
- Subscribe
- Mute
- Printer Friendly Page
Plotting complex numbers in Mathcad Prime 2.0
- Mark as New
- Bookmark
- Subscribe
- Mute
- Subscribe to RSS Feed
- Permalink
- Notify Moderator
Plotting complex numbers in Mathcad Prime 2.0
Hello,
Is there any possibility to plot a diagram formed by vectors representing complex numbers? (see attached file).
I want to visualize the vectors in this file (e.g. in cartesian coordinates). Notice that V1 = V2 + V3, that means all three vectors form a triangle; and I want to visualize this triangle.I have to tell Mathcad that vector V3 does not start from the origin of the cartesian coordinates, but instead starts from the end of vector V2. Same thing for V4, V5 and V6.
Any help would be much appreciated.
Solved! Go to Solution.
- Labels:
-
Algebra_Geometry
Accepted Solutions
- Mark as New
- Bookmark
- Subscribe
- Mute
- Subscribe to RSS Feed
- Permalink
- Notify Moderator
- Mark as New
- Bookmark
- Subscribe
- Mute
- Subscribe to RSS Feed
- Permalink
- Notify Moderator
John Doe schrieb:
Hello,
Is there any possibility to plot a diagram formed by vectors representing complex numbers? (see attached file).
No, at least not nice and comfortable.
See if the attached would help. I've writte two auxiliary functions, one for the representation of a position vector given by a complex number and the second for and addition according to your definition. Arrows are missing and would cost quite some time to implement.
- Mark as New
- Bookmark
- Subscribe
- Mute
- Subscribe to RSS Feed
- Permalink
- Notify Moderator
Here's another approach that let's you plot (somewhat crude) arrows.
Alan
- Mark as New
- Bookmark
- Subscribe
- Mute
- Subscribe to RSS Feed
- Permalink
- Notify Moderator
Elegant solution Alan. However it does not function when I changed the values for vector V3 (it is not the sum of V1 and V2 anymore, but it still should begin at the end of V2).
For this reason I tried to expand your program to consider this case. It worked, only the arrows are now corrupted. Does anyone have a remedy for this?
- Mark as New
- Bookmark
- Subscribe
- Mute
- Subscribe to RSS Feed
- Permalink
- Notify Moderator
John Doe wrote:
Elegant solution Alan. However it does not function when I changed the values for vector V3 (it is not the sum of V1 and V2 anymore, but it still should begin at the end of V2).
If the "end" vector is expressed as a sum of the two vectors that are head to tail the original works ok - see attached.
Alan
- Mark as New
- Bookmark
- Subscribe
- Mute
- Subscribe to RSS Feed
- Permalink
- Notify Moderator
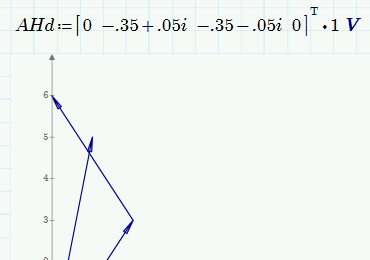
Here's another one I converted from an old worksheet from Tom Gutman.
- Mark as New
- Bookmark
- Subscribe
- Mute
- Subscribe to RSS Feed
- Permalink
- Notify Moderator
This is also a very elegant solution. See its implementation for my current example it worked very fine. However I miss the colorful diagram from Alan's method ![]()
Is it possible here to assign different colors to different vectors?
I also find the arrowhead in Alan's method finer. Is it possible to change the shape of the arrowheads here? I tried to manipulate the values in AHd but didn't help.
- Mark as New
- Bookmark
- Subscribe
- Mute
- Subscribe to RSS Feed
- Permalink
- Notify Moderator
Is it possible here to assign different colors to different vectors?
Only by plotting the arrows individually.
I also find the arrowhead in Alan's method finer. Is it possible to change the shape of the arrowheads here? I tried to manipulate the values in AHd but didn't help.
That's what the multiplier of "1" is for. It scales the arrow heads.
- Mark as New
- Bookmark
- Subscribe
- Mute
- Subscribe to RSS Feed
- Permalink
- Notify Moderator
I also find the arrowhead in Alan's method finer. Is it possible to change the shape of the arrowheads here? I tried to manipulate the values in AHd but didn't help.
According to scaling the size see Richards answer.
If you think (like me) that narrower arrows would look better, you have to change the the -0.5+/-0.3i to somethings else, e.g. ratio 7:1, in the definiton of AHd, I personally prefer switching the last two elements in that vector, too, making up kind of a "full" arrow..

- Mark as New
- Bookmark
- Subscribe
- Mute
- Subscribe to RSS Feed
- Permalink
- Notify Moderator
- Mark as New
- Bookmark
- Subscribe
- Mute
- Subscribe to RSS Feed
- Permalink
- Notify Moderator
Thank you for your useful contributions. I hope one day this method will be implemented as a buit-in function in Mathcad Prime. Vector diagrams are useful in many engineering areas.
- Mark as New
- Bookmark
- Subscribe
- Mute
- Subscribe to RSS Feed
- Permalink
- Notify Moderator
Hello all, I just need to find way how to plot phasors (= vectors in electrical engineering) in polar coordinates in Prime6.
I want to plot individual vectors, voltages, currents, impedances, powers and sums and products of corresponding vectors, starting from origo and starting from endpoint of preceding vector.
I hope to get answer from someone.
rgd matti
- Mark as New
- Bookmark
- Subscribe
- Mute
- Subscribe to RSS Feed
- Permalink
- Notify Moderator
How about you have a look at 'Insert' -> 'Polar Plot' from the 'Plots' menu....
If you are unsure about how to use it, consult the help. It has a nice example.
For further help: do attach your worksheet with some examples of data you want to plot.
Success!
Luc
- Mark as New
- Bookmark
- Subscribe
- Mute
- Subscribe to RSS Feed
- Permalink
- Notify Moderator
I have seen all examples etc. ...
Let´s have an example:
Voltage V1:= 230V in angle 30 degrees.
Voltage V2:= 92V in angle 0 degrees.
I simply want to calculate and PLOT
phasors V1 and V2 in POLAR COORINATES
and
phasor V3:= V1 - V2, starting from tip of arrow V2 ending to end of phasor V1, in POLAR COORDINATES
It would be nice to hear if You really can help me with example plot in PTC Mathcad Prime 6 file.
regards Matti Paaso
- Mark as New
- Bookmark
- Subscribe
- Mute
- Subscribe to RSS Feed
- Permalink
- Notify Moderator
So you are not looking for a polar plot, you just want to draw a few arrows given by magnitude and phase.
As you already learned in this thread, Prime does not offer away to easily draw vectors, so we have to write our own routines.
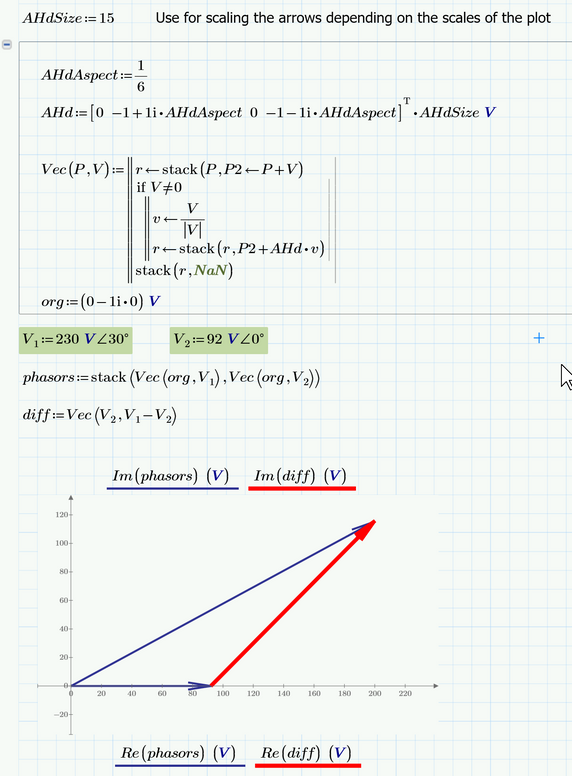
Richard already provided a way to do it in his answers to the original question - whats wrong with it in your opinion? Maybe you are not aware that you can define complex numbers using the versor notation (menu ribbon "Calculate", "Operators").
All thats left to do now is to scale the arrows according to the dimensions of your plot (AHdSize) and take care that both axis are scales approximately the same to avoid distortions of the arrows.
Here is your example and I just used Richards solution as given by him above. The difference vector was made a separate plot to be able to color it differently.
- Mark as New
- Bookmark
- Subscribe
- Mute
- Subscribe to RSS Feed
- Permalink
- Notify Moderator
LOT OF THANKS Werner, it took me just 2 hours to add vector plots to my teaching material as You can see (if You want to take a look). I still want to add polar plotting on the background of phasor diagram TO GET x- and y-scales just same so that phase shift angles etc. can be seen correctly, .... and of course I want to add angle measurement tools for indicating phase shift between supply voltage and supply current etc.
Regards Matti
- Mark as New
- Bookmark
- Subscribe
- Mute
- Subscribe to RSS Feed
- Permalink
- Notify Moderator
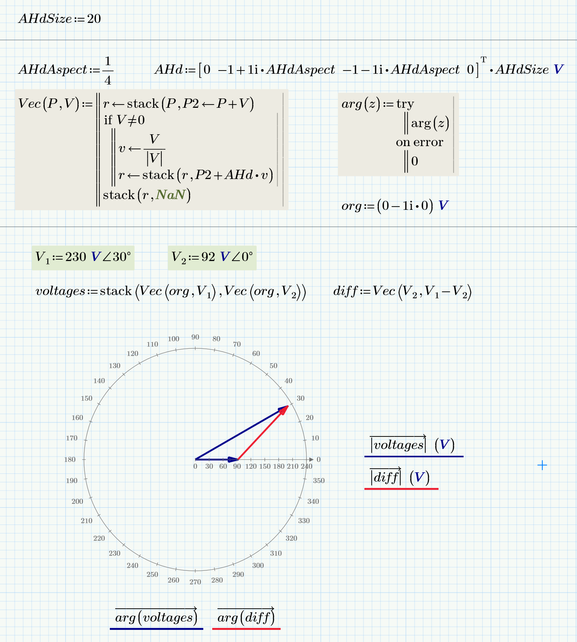
Sure, you won't have the scaling problem when using a polar plot, but then the illustration might get too tiny as you are forced to use the full circle. Prime's suitability for illustrations is unfortunately very limited.
You can use the very same approach as shown above with a polar plot, too. Instead of "Re" and "Im" you use the magnitude (absolute value, |..|) and the phase ("arg" function) at the appropriate place holders. Furthermore you have to vectorize the function calls, otherwise "|voltages|" would return a single scalar value - the magnitude of the vector voltages, instead of a vector of multiple magnitudes.
We also have to redefine Prime's "arg" function to not throw an error if the argument is zero. Prime is mathematically correct in this respect as the phase of 0+0j IS undefined, but for our purpose its better to set the phase to 0 in that case.
Prime 6 worksheet attached.
- Mark as New
- Bookmark
- Subscribe
- Mute
- Subscribe to RSS Feed
- Permalink
- Notify Moderator
Lot´s of thanks to You.
Can we continue conversation in future ... on those circuit theory issues
.... perhaps simulating slowly enough rotating voltage and current phasors ...
regards matti
- Mark as New
- Bookmark
- Subscribe
- Mute
- Subscribe to RSS Feed
- Permalink
- Notify Moderator
You are welcome. Feel free to use this forum for what it is intended for.
Ask our questions, but its better to open a new thread. Otherwise, your question could easily be overlooked
- Mark as New
- Bookmark
- Subscribe
- Mute
- Subscribe to RSS Feed
- Permalink
- Notify Moderator
Can we continue conversation in future ... on those circuit theory issues
.... perhaps simulating slowly enough rotating voltage and current phasors ...
If you're going to use Prime it will have to be much later--Prime does not support animation. Now, if you want to use Mathcad 15 . . .


