- Subscribe to RSS Feed
- Mark Topic as New
- Mark Topic as Read
- Float this Topic for Current User
- Bookmark
- Subscribe
- Mute
- Printer Friendly Page
Polar plot
- Mark as New
- Bookmark
- Subscribe
- Mute
- Subscribe to RSS Feed
- Permalink
- Notify Moderator
Polar plot
This is a very elementary question, but I cannot find a solution. I have two columns of numbers, the first (angles) goes from 0 to 90 in steps of 10, but I plot them in radians. The second column is the measurement result at each angle, i.e. 10 values, the first being zero and the others are negative values down to -21. When I try to make a polar plot, I get the measurement values plotted in the 240 to 270 degree sector, and the radial axis goes from 0 in the centre to +21 at the perimeter.
If I try plotting in degrees, I get a bizarre scatter plot over the whole circle, but only 7 points are plotted.
How can I plot these data correctly?
Solved! Go to Solution.
- Labels:
-
Electrical_Engineering
-
Mathcad Usage
Accepted Solutions
- Mark as New
- Bookmark
- Subscribe
- Mute
- Subscribe to RSS Feed
- Permalink
- Notify Moderator
@JohnWoodgate wrote:
Thank you, but that still produces a completely wrong plot. One error is
that the radial axis goes from 0 to 21, but the data values go from 0
to -21. Also, not all the points are plotted. See the attached.
There is nothing attached to your post.
But take a second look at my picture!
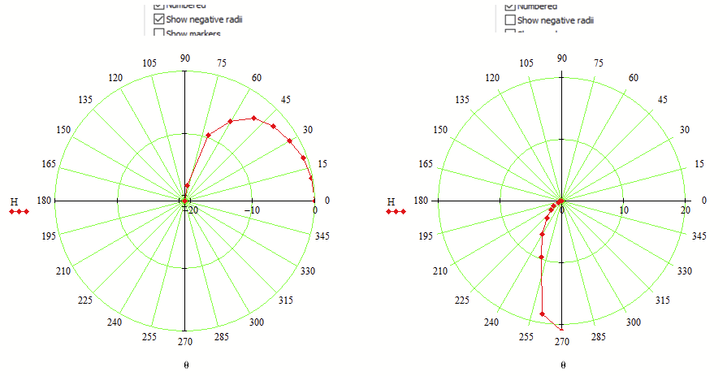
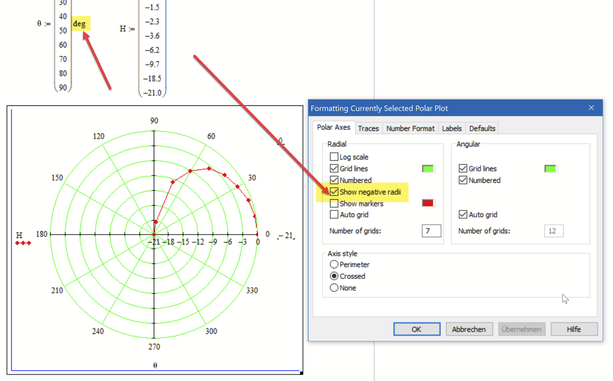
1) ALL 10 points are plotted and I even marked them with dots
2) Look closely at the radial scale! Because I checked "Show negative radii" the scale runs from -21 at the center to 0 at the outside. You can change those values at the appropriate placeholders at the right of the plot.
If you turn off "Show negative radii" (which is the default setting), the radial scale runs from 0 in the center to +21 at the outside. And of course the value of -6.2 for 60° is seen in the plot as +6.2 at 240° (the extension in negatives of 60 degrees).
This is shown below in the plot on the right side.
If none of these is what you expected, can you show which kind of plot you'd like to see with the data provides.
- Mark as New
- Bookmark
- Subscribe
- Mute
- Subscribe to RSS Feed
- Permalink
- Notify Moderator
It looks like you are inputting the data in radians not degrees. you need to multiply f by degrees then convert to radians.
- Mark as New
- Bookmark
- Subscribe
- Mute
- Subscribe to RSS Feed
- Permalink
- Notify Moderator
attached.
- Mark as New
- Bookmark
- Subscribe
- Mute
- Subscribe to RSS Feed
- Permalink
- Notify Moderator
Would this help
Instead of adding deg in the definition of theta you might write theta*deg in the placeholder of the plot.
Even though the polar plot shows angles in degree, angles in Mathcad always are in radian unless you explicitly state that the value are degrees.
- Mark as New
- Bookmark
- Subscribe
- Mute
- Subscribe to RSS Feed
- Permalink
- Notify Moderator
that the radial axis goes from 0 to 21, but the data values go from 0
to -21. Also, not all the points are plotted. See the attached.
- Mark as New
- Bookmark
- Subscribe
- Mute
- Subscribe to RSS Feed
- Permalink
- Notify Moderator
@JohnWoodgate wrote:
Thank you, but that still produces a completely wrong plot. One error is
that the radial axis goes from 0 to 21, but the data values go from 0
to -21. Also, not all the points are plotted. See the attached.
There is nothing attached to your post.
But take a second look at my picture!
1) ALL 10 points are plotted and I even marked them with dots
2) Look closely at the radial scale! Because I checked "Show negative radii" the scale runs from -21 at the center to 0 at the outside. You can change those values at the appropriate placeholders at the right of the plot.
If you turn off "Show negative radii" (which is the default setting), the radial scale runs from 0 in the center to +21 at the outside. And of course the value of -6.2 for 60° is seen in the plot as +6.2 at 240° (the extension in negatives of 60 degrees).
This is shown below in the plot on the right side.
If none of these is what you expected, can you show which kind of plot you'd like to see with the data provides.
- Mark as New
- Bookmark
- Subscribe
- Mute
- Subscribe to RSS Feed
- Permalink
- Notify Moderator
mailer@us.khoros-mail.com, which rejects my responses. When I look on
the web site, I can see your explanation, which I accept. I tried
'negative radii' earlier, but obviously another error prevented it
resolving the issue.
- Mark as New
- Bookmark
- Subscribe
- Mute
- Subscribe to RSS Feed
- Permalink
- Notify Moderator
Thank you. That is the solution.
- Mark as New
- Bookmark
- Subscribe
- Mute
- Subscribe to RSS Feed
- Permalink
- Notify Moderator
I sometimes wager with students. I ask them if it is possible to see the whole plot sin(x). All students say in unison - no !!! Then I show them this graph!
- Mark as New
- Bookmark
- Subscribe
- Mute
- Subscribe to RSS Feed
- Permalink
- Notify Moderator
I'm afraid your message is too cryptic for me. I think the complete polar graph of sin(x) is a figure 8.
- Mark as New
- Bookmark
- Subscribe
- Mute
- Subscribe to RSS Feed
- Permalink
- Notify Moderator
I thought so too until I plotted sin.
The Figure 8
- Mark as New
- Bookmark
- Subscribe
- Mute
- Subscribe to RSS Feed
- Permalink
- Notify Moderator
@JohnWoodgate wrote:
I'm afraid your message is too cryptic for me. I think the complete polar graph of sin(x) is a figure 8.
No, the polar plot of the sine function is a single circle that is traversed twice when the angle runs from 0 to 2 pi. This is because of the negative values for angles from pi to 2pi.
I personally find polar plots where zero is not in the center very irritating and therefore usually avoid the option of showing negative radii.
In the plot on the right I have drawn the zero radius in black and did not put -1 in the center, but rather -1.2. Therefore the curve is not a standard cardioid.
If you double the frequency you get the four-leaf clover in a normal polar plot and the figure eight if you allow negative radii. You can rotate the figure by applying some phase shift (as Valery already had shown).
Another way to get a figure eight is using the absolute value of the sine. Actually what you get are two circles:


