Community Tip - You can Bookmark boards, posts or articles that you'd like to access again easily! X
- Subscribe to RSS Feed
- Mark Topic as New
- Mark Topic as Read
- Float this Topic for Current User
- Bookmark
- Subscribe
- Mute
- Printer Friendly Page
Preparing Time Series for Data Analysis
- Mark as New
- Bookmark
- Subscribe
- Mute
- Subscribe to RSS Feed
- Permalink
- Notify Moderator
Preparing Time Series for Data Analysis
By Frank Smietana

Useful Techniques for Time Series
About this worksheet:
- Shows the necessary steps to prepare real world experimental data analyses and illustrates the functionality provided in PTC Mathcad to optimally expose information content of a data set
- Applicable in academia, scientific research, industrial process, experimental analysis, and finance
- Introduces moving averages and detrending, along with data input techniques, PTC Mathcad in-line programming, 2D series plots, and user defined functions
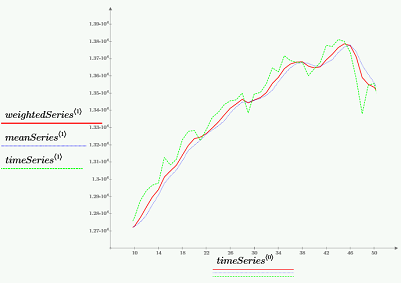
This PTC Mathcad worksheet shows you how to prepare real world experimental data analysis with PTC Mathcad software, and how to expose information content in a data set. Averages and detrending are two very effective techniques used to prepare time series data for statistical modeling and forecasting applications.
This worksheet shows how you can import a data file consisting of time series data into PTC Mathcad. Certain user defined functions have been written to make the process of using this data in plots easier by stripping unwanted header information. A moving average filter to smooth out data fluctuations, as well as a more complex weighted moving average approach, are compared in the worksheet.
A detrending algorithm that involves differencing your times series is also displayed. This is a simple but effective tool for removing a trend from the data that is used. Any resulting prediction means that there should be less bias in forecasts based on the time series data.
This worksheet using PTC Mathcad is complete with notation, graphs, data and solutions to aid you in learning.
Download and explore this worksheet yourself! You can download a free lifetime copy of PTC Mathcad Express and get 30 days of full functionality.
- Labels:
-
Statistics_Analysis


