Community Tip - New to the community? Learn how to post a question and get help from PTC and industry experts! X
- Subscribe to RSS Feed
- Mark Topic as New
- Mark Topic as Read
- Float this Topic for Current User
- Bookmark
- Subscribe
- Mute
- Printer Friendly Page
Problem with polts
- Mark as New
- Bookmark
- Subscribe
- Mute
- Subscribe to RSS Feed
- Permalink
- Notify Moderator
Problem with polts
Hi
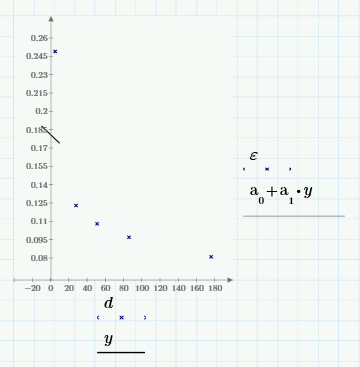
I have one small problem with Mathcad plots. Mathcad plots my function only in part of it insted of filling whole XY plane. I attach my mathcad file as an example. What can I do for the plot to be bigger?
Solved! Go to Solution.
- Labels:
-
Other
Accepted Solutions
- Mark as New
- Bookmark
- Subscribe
- Mute
- Subscribe to RSS Feed
- Permalink
- Notify Moderator
From your graph (y only goes from -10 to 10) I'd guess you didn't define the range you wanted for y. If you don't define a range, Mathcad plots from -10 to 10.
define y to be a range variable
y:=0..180
and your line will extend to that span.
- Mark as New
- Bookmark
- Subscribe
- Mute
- Subscribe to RSS Feed
- Permalink
- Notify Moderator
Using a range variable as suggested by Fred may give you the better control, but the -10 to 10 limit is only there if you let chose Prime the scale automatically.
If you click on the 180 of the horizontal axis and retype the 180 manually, you get the plot you expected

BTW, you can do without F and "linefit" if you use simply "line"

Wouldn't an exponential provide a better fit?

- Mark as New
- Bookmark
- Subscribe
- Mute
- Subscribe to RSS Feed
- Permalink
- Notify Moderator
thank you all, you are awesome ![]()


