Turn on suggestions
Auto-suggest helps you quickly narrow down your search results by suggesting possible matches as you type.
Showing results for
Please log in to access translation
Turn on suggestions
Auto-suggest helps you quickly narrow down your search results by suggesting possible matches as you type.
Showing results for
Community Tip - When posting, your subject should be specific and summarize your question. Here are some additional tips on asking a great question. X
Translate the entire conversation x
Please log in to access translation
Options
- Subscribe to RSS Feed
- Mark Topic as New
- Mark Topic as Read
- Float this Topic for Current User
- Bookmark
- Subscribe
- Mute
- Printer Friendly Page
Sampling and aliasing in Mathcad 15
Jan 22, 2017
08:18 PM
- Mark as New
- Bookmark
- Subscribe
- Mute
- Subscribe to RSS Feed
- Permalink
- Notify Moderator
Please log in to access translation
Jan 22, 2017
08:18 PM
Sampling and aliasing in Mathcad 15
I would like to plot a sine wave, and then show the effect of sampling it at different frequencies. This will demonstrate aliasing if the sample rate is too low. How can I do this? Thanks.
Labels:
- Labels:
-
Other
3 REPLIES 3
Jan 22, 2017
11:10 PM
- Mark as New
- Bookmark
- Subscribe
- Mute
- Subscribe to RSS Feed
- Permalink
- Notify Moderator
Please log in to access translation
Jan 22, 2017
11:10 PM
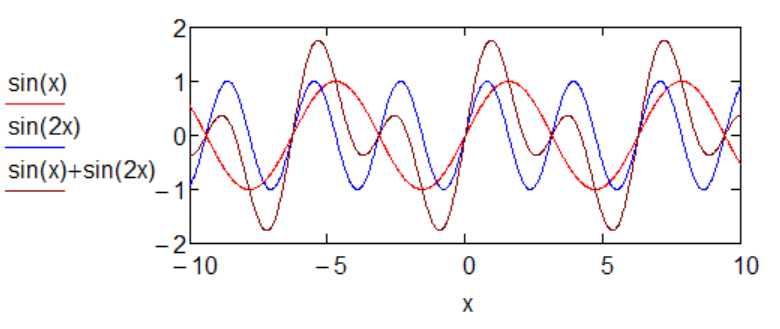
May be so

Jan 23, 2017
02:59 AM
- Mark as New
- Bookmark
- Subscribe
- Mute
- Subscribe to RSS Feed
- Permalink
- Notify Moderator
Please log in to access translation
Jan 23, 2017
02:59 AM
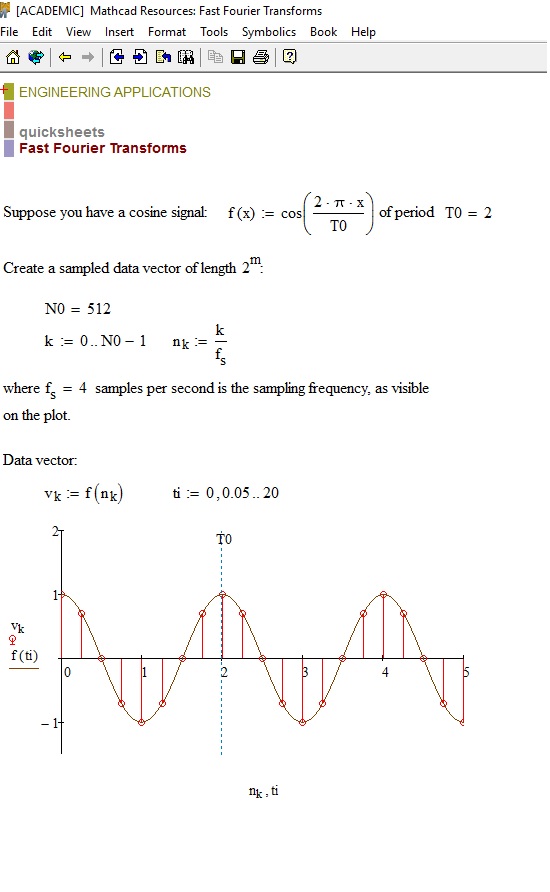
Search in the help of mathcad QuickSheet, the word sampling ...

Jan 23, 2017
07:52 AM
- Mark as New
- Bookmark
- Subscribe
- Mute
- Subscribe to RSS Feed
- Permalink
- Notify Moderator
Please log in to access translation


