- Subscribe to RSS Feed
- Mark Topic as New
- Mark Topic as Read
- Float this Topic for Current User
- Bookmark
- Subscribe
- Mute
- Printer Friendly Page
Sum of value above
- Mark as New
- Bookmark
- Subscribe
- Mute
- Subscribe to RSS Feed
- Permalink
- Notify Moderator
Sum of value above
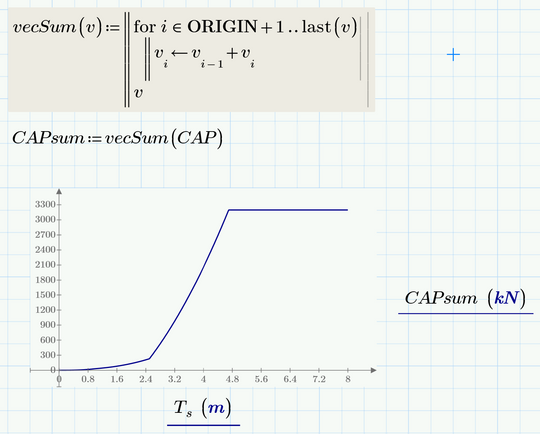
Hello, I am trying to create a value for the sum above to then plot in an overall graph of capacity vs increments.so capacity vs Ts.idx (100mm) increments.
Increment
Ts.idx 0 would be 0
Ts.idx 0.1 would be 0.08+0=0.08
Ts.idx 0.2 would be 0.321+0.08+0=0.401
etc and so on.
so, the value of Ts.idx and everything above it
Then I can see quiet easily and what total length would be needed to resist the ULS load in a good visual output.
Solved! Go to Solution.
- Labels:
-
Civil_Engineering
Accepted Solutions
- Mark as New
- Bookmark
- Subscribe
- Mute
- Subscribe to RSS Feed
- Permalink
- Notify Moderator
Are you looking for something like this?
You could do without the utility function vecSum
but I won't recommend it.
- Mark as New
- Bookmark
- Subscribe
- Mute
- Subscribe to RSS Feed
- Permalink
- Notify Moderator
Are you looking for something like this?
You could do without the utility function vecSum
but I won't recommend it.
- Mark as New
- Bookmark
- Subscribe
- Mute
- Subscribe to RSS Feed
- Permalink
- Notify Moderator
Yes, thank you Werner_E very helpful


