Community Tip - Have a PTC product question you need answered fast? Chances are someone has asked it before. Learn about the community search. X
- Subscribe to RSS Feed
- Mark Topic as New
- Mark Topic as Read
- Float this Topic for Current User
- Bookmark
- Subscribe
- Mute
- Printer Friendly Page
Surface Fill on 3D Graph Express Prime 2.0
- Mark as New
- Bookmark
- Subscribe
- Mute
- Subscribe to RSS Feed
- Permalink
- Notify Moderator
Surface Fill on 3D Graph Express Prime 2.0
Hi All
I have plotted a 3d graph from data using a matrix.
The data represents the height of a certain part of a pcb board, and the XY location of that height. I have put the data in and i have a 3D scatter graph, I want to now have the surface fill option but when i go to the tool bar the surface fill option is greyed out.
Any suggestions welcome!
Thanks Sam
- Labels:
-
Statistics_Analysis
- Mark as New
- Bookmark
- Subscribe
- Mute
- Subscribe to RSS Feed
- Permalink
- Notify Moderator
You may consider attaching your worksheet. You can do this by clicking on "Use advanced editor" at the upper right.
The problem may be due to some bad limitations in Prime2 concerning the overall number of points in a plot, but its hard to say without seeing the worksheet.
- Mark as New
- Bookmark
- Subscribe
- Mute
- Subscribe to RSS Feed
- Permalink
- Notify Moderator
Attached
The big matrix on the left is all the data.
Have tryed that in the graph but doesnt work.
- Mark as New
- Bookmark
- Subscribe
- Mute
- Subscribe to RSS Feed
- Permalink
- Notify Moderator
OK, I see the problem. Its the data structure you had chosen. You have just a single matrix consisting of the coordinates of 80 points. All you can do with that is plotting a 3D polygon, connecting the points in the order they are in your vector. As you don't have a surface but just a 3D curve, Prime does not offer surface fill.
As you want a surface to be plotted you would have provide the data in a different way. Either provide analytical functions or a datastructure consisting of 3 n x m matrices nested in a vector. Each of these matrices would correspond to x-, y- and z-coordinates respectively and that way each point would not just have two neighbours is can be connected with as in you structure, but would have ave four neighbours - thus creating a surface mesh which then could be filled. This kind of structure can be created by hand or, if you provide analytical functions is automatically created using Createmesh() which you can lookup in the help.
It doesnt seem practicable to derive the necessary structure from the vector you provide. How was the data you provided derived?
- Mark as New
- Bookmark
- Subscribe
- Mute
- Subscribe to RSS Feed
- Permalink
- Notify Moderator
Right think i understand.
The data is the output from a CMM machiene. Trying to see the difference in height of chips on a pcb board.
I have now found this thread
http://communities.ptc.com/message/203078#203078
Will see if doing it that way round (this is what you have suggested?) works.
Sam
- Mark as New
- Bookmark
- Subscribe
- Mute
- Subscribe to RSS Feed
- Permalink
- Notify Moderator
Hi
I have now managed to get it working! I can get the surface fill to work and everything.
Is there a way to have it so the colour of the chip surfaces chances with height? So when looking you can see high/low points etc etc etc
- Mark as New
- Bookmark
- Subscribe
- Mute
- Subscribe to RSS Feed
- Permalink
- Notify Moderator
Is there a way to have it so the colour of the chip surfaces chances with height? So when looking you can see high/low points etc etc etc
We had that feature with the use of colormaps in Mathcad 15 and below, but unfortunately not in Prime2 and as far as I am aware of not in Prime3 either.
You may consider using a contourplot.
NB: I just had a look at your data and I realized you have a 4 x 20 data matrix anyway. So you could extract the data in the format necessary and do like Alan showed in the thread you mentioned or you may create an 2D-interpolation function and use this for plotting. Not sure if you would be able to do so with Prime Express as I think that programming is considered a premium feature and not available there.
- Mark as New
- Bookmark
- Subscribe
- Mute
- Subscribe to RSS Feed
- Permalink
- Notify Moderator
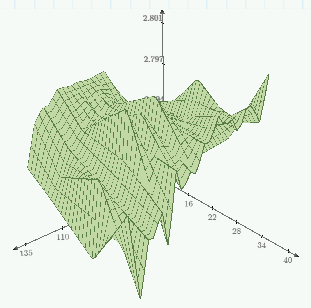
Here is what I came up with the data you provided and using an interpolating function (for better smoothness of the graph).
I am not sure if you can use it in the Express version, though. I have provides the matrices X,Y,Z by assignments, too, so you may use them the way Alan had shown.

- Mark as New
- Bookmark
- Subscribe
- Mute
- Subscribe to RSS Feed
- Permalink
- Notify Moderator
Thanks very much.
Will take a look and try to get head round it.
Thanks Again
Sam
- Mark as New
- Bookmark
- Subscribe
- Mute
- Subscribe to RSS Feed
- Permalink
- Notify Moderator
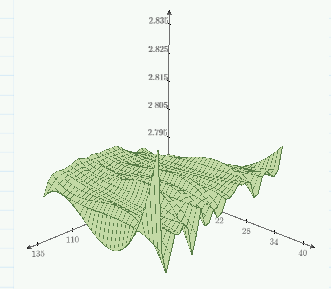
As I wrote I did interpolation for better smoothness of the plot I shouldn't have used linear interpolation 😉
Here is the result using cubic spline interpolation.


