Community Tip - You can change your system assigned username to something more personal in your community settings. X
- Community
- PTC Education
- PTC Education Forum
- 3D Plotting with 3 different units
- Subscribe to RSS Feed
- Mark Topic as New
- Mark Topic as Read
- Float this Topic for Current User
- Bookmark
- Subscribe
- Mute
- Printer Friendly Page
3D Plotting with 3 different units
- Mark as New
- Bookmark
- Subscribe
- Mute
- Subscribe to RSS Feed
- Permalink
- Notify Moderator
3D Plotting with 3 different units
Hi everyone,
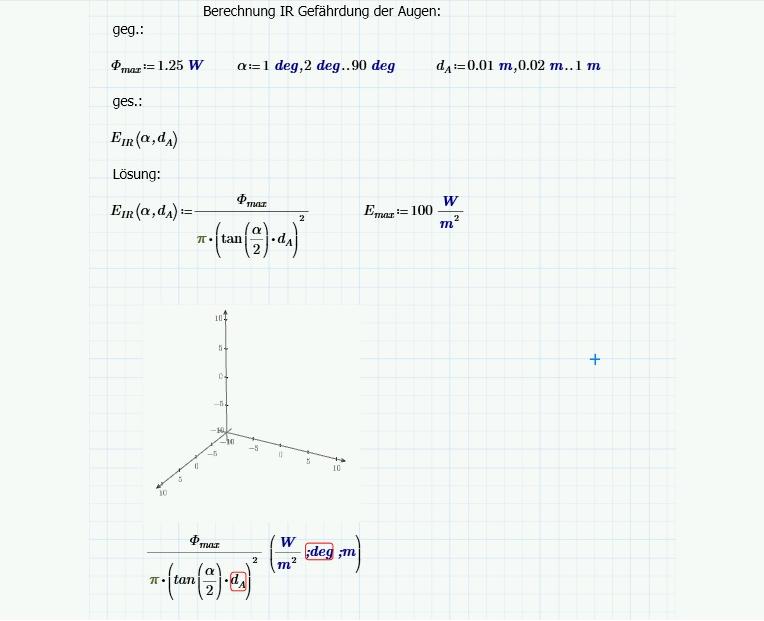
I have a Problem by 3d plotting a function.
Unfortunally I don't know what the problem is about, I have 3 unit types.
W / m²
m
deg
Z-Axis should be W / m²
x axis m
y axis deg
Could please anybody check my mathcad file and correct the error, or tell me what to do?
In the second step I need to insert a constant surface into the plot, with the value of 100 W / m².
I want to compare the curve from E.IR with the constant surface. Interesting is
every E.IR value which is above the limit of 100 W / m².
Thanks a lot for your help!
PS: Here you can see my worksheet, I also attached my mathcad file.

Best Regards,
Alexander


