
Turn on suggestions
Auto-suggest helps you quickly narrow down your search results by suggesting possible matches as you type.
Showing results for
Turn on suggestions
Auto-suggest helps you quickly narrow down your search results by suggesting possible matches as you type.
Showing results for
Community Tip - Stay updated on what is happening on the PTC Community by subscribing to PTC Community Announcements. X
Options
- Subscribe to RSS Feed
- Mark Topic as New
- Mark Topic as Read
- Float this Topic for Current User
- Bookmark
- Subscribe
- Mute
- Printer Friendly Page
2D Diagramm does not display correctly.
Apr 24, 2013
02:29 PM
- Mark as New
- Bookmark
- Subscribe
- Mute
- Subscribe to RSS Feed
- Permalink
- Notify Moderator
Apr 24, 2013
02:29 PM
2D Diagramm does not display correctly.
Hello,
on my PC some Diagramms are not displayed correctly, and the files display correctly on another pc in my school.
My teacher has a program going, each pupil buys a pupils licence for matcad from him for like 5$,
and i am the only on with this error.
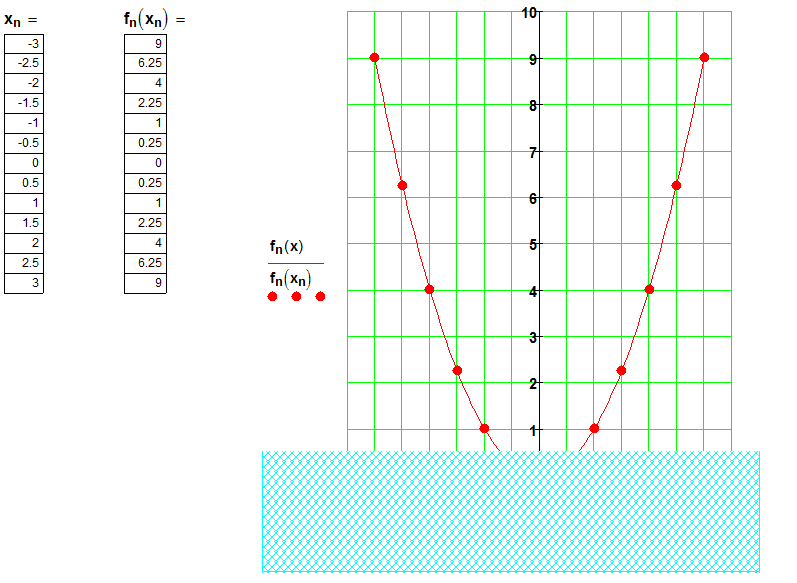
Normaly the blue area should be a diagramm of a f=x² funktion.
but it only displays immediately after opening the file, after klicking on the diagramm it transforms into this blue mess.
thx
Tobias
Labels:
- Labels:
-
Physics
9 REPLIES 9
Apr 24, 2013
03:00 PM
- Mark as New
- Bookmark
- Subscribe
- Mute
- Subscribe to RSS Feed
- Permalink
- Notify Moderator
Apr 24, 2013
03:00 PM
Send please the Mathcad file...
Apr 24, 2013
03:09 PM
- Mark as New
- Bookmark
- Subscribe
- Mute
- Subscribe to RSS Feed
- Permalink
- Notify Moderator
Apr 24, 2013
03:09 PM
In this specific file only the first diagramm shows this error, the others work.
Apr 24, 2013
03:18 PM
- Mark as New
- Bookmark
- Subscribe
- Mute
- Subscribe to RSS Feed
- Permalink
- Notify Moderator
Apr 24, 2013
03:18 PM
Ha Ge wrote:
In this specific file only the first diagramm shows this error, the others work.
All is OK in my Mathcad.
Do this diagramm second 
Apr 24, 2013
03:41 PM
- Mark as New
- Bookmark
- Subscribe
- Mute
- Subscribe to RSS Feed
- Permalink
- Notify Moderator
Apr 24, 2013
03:41 PM
Somehow, it just started working after resaving it as a xmcd. No idea why!!
Totaly crazy.
Thanks anyway
Tobias
Apr 24, 2013
03:39 PM
- Mark as New
- Bookmark
- Subscribe
- Mute
- Subscribe to RSS Feed
- Permalink
- Notify Moderator
Apr 24, 2013
03:39 PM
Its hard to tell from the distance what the cause for that behaviour could be. As other people can view the files w/o problem it seems that the file is OK (Mathe Nexus files are created with rather old versions of Mathcad, but this usually is no problem).
Which OS is MC installed on. There are reports of 3D-plots not working under Win7 or Win8 and one of the workarounds is to decrease colordepth (from 32bit to 16bit). Not sure if this would help in your case as I am not aware having read about a 2D display problem before.
When you installed MC, was there a situation when MC wrote that it would need certain files, you clicked continue and MC seemed to install w/o problems nevertheless?
Do you encounter that problem only with precreated files from the same source only or does it happen with plots you create yourself, too?
Is there a pattern, e.g. is it always the first plot in file which does not show up correctly (as in the file you posted)?
Does dragging the plot region around the page change anything?
Do you get the format-menu when you doubleclick the plot region?
Does it help if you save the file immmedeatly after opening in MC15 format and then open that file?
Sorry, I'm just poking around without having a distinct clue.
You may consider calling PTC support - maybe they know about that effect.
Apr 24, 2013
03:44 PM
- Mark as New
- Bookmark
- Subscribe
- Mute
- Subscribe to RSS Feed
- Permalink
- Notify Moderator
Apr 24, 2013
03:44 PM
There wasnt any warning while installing it that i can remember.
The really anoying thing is that most of the diagramms work on the first try, only some of them show this error. I have Win7 64, so if this error reappears, i will try to change the displaysettings around to see if it changes anything.
Thanks.
Tobias
Apr 24, 2013
10:48 PM
- Mark as New
- Bookmark
- Subscribe
- Mute
- Subscribe to RSS Feed
- Permalink
- Notify Moderator
Apr 24, 2013
10:48 PM
Ha Ge wrote:
I have Win7 64,
Sorry, Mathcad 15 can full correct work only in Win XP. Mathcad Prime/Express is for Win 7.
PS
I have worked in Stuttgarf Uni - IVD
Apr 24, 2013
03:42 PM
- Mark as New
- Bookmark
- Subscribe
- Mute
- Subscribe to RSS Feed
- Permalink
- Notify Moderator
Apr 24, 2013
03:42 PM
Ha Ge wrote:
Hello,
on my PC some Diagramms are not displayed correctly, and the files display correctly on another pc in my school.
My teacher has a program going, each pupil buys a pupils licence for matcad from him for like 5$,
You can use for your ausgabe free Mathcad Express
Apr 24, 2013
03:46 PM
- Mark as New
- Bookmark
- Subscribe
- Mute
- Subscribe to RSS Feed
- Permalink
- Notify Moderator
Apr 24, 2013
03:46 PM
Thanks everyone for your quick respones. I found a workaround that seems to work most of the time; by resaving the mcd as xmcd the error seems to go away most of the time.
Thanks everyone.
Tobias

