
Turn on suggestions
Auto-suggest helps you quickly narrow down your search results by suggesting possible matches as you type.
Showing results for
Turn on suggestions
Auto-suggest helps you quickly narrow down your search results by suggesting possible matches as you type.
Showing results for
Community Tip - Did you get called away in the middle of writing a post? Don't worry you can find your unfinished post later in the Drafts section of your profile page. X
Options
- Subscribe to RSS Feed
- Mark Topic as New
- Mark Topic as Read
- Float this Topic for Current User
- Bookmark
- Subscribe
- Mute
- Printer Friendly Page
3d surface plot from excel data?
May 05, 2017
12:16 PM
- Mark as New
- Bookmark
- Subscribe
- Mute
- Subscribe to RSS Feed
- Permalink
- Notify Moderator
May 05, 2017
12:16 PM
3d surface plot from excel data?
Hello,
I am brand new to Mathcad so I apologize if this is an easy question. I've been through the help, and the tutorials and have had no luck.
I have a simple spreadsheet in excel of histogram data (small sample below). The top row represents the Y index, measuring the value of each histogram bucket.
The left-most column represents timestamps for each sample of data -- the X index.
The values in each cell represent the number of occurrences for a given value (bucket, Y index) at a given timestamp -- the Z index.
I would like to import this data into Mathcad and create a 3d surface plot. I know how to get the data into Mathcad, but all I get is a blank graph. Does anyone have any examples or tutorials of how to do this? Surely this is a common need.
Thank you.
| 1 | 2 | 4 | 8 | 16 | 32 | |
| 17:01-17:30 | 1670995 | 75712 | 65809 | 661907 | 817427 | 216244 |
| 17:30-18:00 | 1546502 | 91738 | 74679 | 686224 | 820159 | 204462 |
| 18:00-18:30 | 1639341 | 150381 | 87648 | 784233 | 1109512 | 339081 |
| 18:30-19:00 | 1546927 | 132118 | 72679 | 649977 | 866845 | 238341 |
| 19:00-19:30 | 1087091 | 167266 | 67597 | 292952 | 503678 | 210493 |
| 19:30-20:00 | 813362 | 177597 | 78544 | 388717 | 693704 | 299647 |
Labels:
- Labels:
-
Statistics_Analysis
- Tags:
- 3d-plot
5 REPLIES 5
May 05, 2017
03:36 PM
- Mark as New
- Bookmark
- Subscribe
- Mute
- Subscribe to RSS Feed
- Permalink
- Notify Moderator
May 05, 2017
03:36 PM
I'm assuming you're using Prime. Attached is Prime 3.0, readable in 3.1 or 4.0.
Technique works in Mathcad 15 as well, much more control over plot appearance.
May 05, 2017
04:09 PM
- Mark as New
- Bookmark
- Subscribe
- Mute
- Subscribe to RSS Feed
- Permalink
- Notify Moderator
May 05, 2017
04:09 PM
This is similar to Fred's. Except some different plots. 3D plots as Fred made seem to be restricted to having the X and Y simply be counters (1,2,3, etc) The contour plot isn't what you asked for, but may be the most visual.
May 05, 2017
05:02 PM
- Mark as New
- Bookmark
- Subscribe
- Mute
- Subscribe to RSS Feed
- Permalink
- Notify Moderator
May 05, 2017
05:02 PM
Here's an extension with a mesh. And I think I had my Z_i,j backwards. 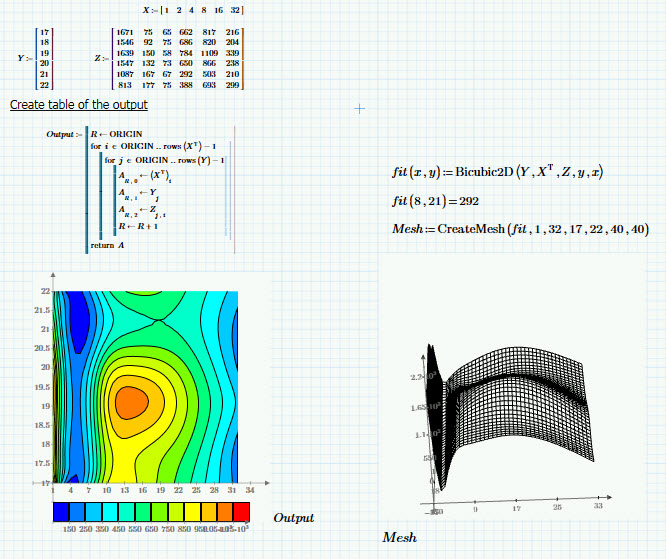
May 05, 2017
05:10 PM
- Mark as New
- Bookmark
- Subscribe
- Mute
- Subscribe to RSS Feed
- Permalink
- Notify Moderator
May 05, 2017
05:10 PM
Please attach the actual File.
I'm very interrested in creating meshs with programming and Vektors.
I want to do this with data from my Garmin device when cycling tours are finished.
Wanna see the Altitude in the contour-Plot.
...beeing not really familiar with this programming...
Thank you!
Volker
Volker
May 06, 2017
09:08 AM
- Mark as New
- Bookmark
- Subscribe
- Mute
- Subscribe to RSS Feed
- Permalink
- Notify Moderator
May 06, 2017
09:08 AM
Always state which version (and subversion) of Mathcad you are using! Prime or real Mathcad. If Prime then its very important to state the exact version, as they are incompatible (at least they are not compatible in a useful way).
Also it would always help if you attach your worksheet.
I guess you know how to get your excel data in Mathcad and how to split row- and column-header and data.
You could plot your data right away but have to take into account a lot of drawbacks.
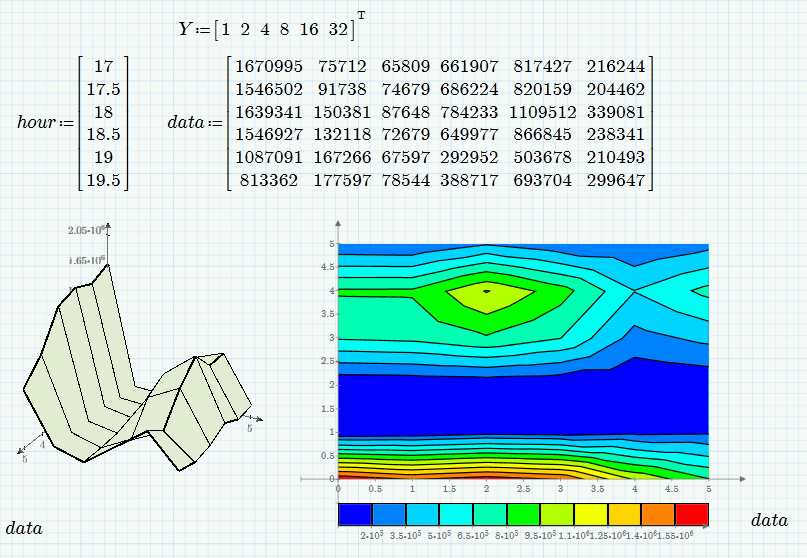
You lose the information about x (time) and Y. Those values are substituted by the sequence 0,1,2,3,4,5.
Because of this you see a wrong (logarithmic) scale in y direction!
Depending on what you are looking for there a different approaches.
You may want to interpolate your data, turning the table into a function.
Simplest form is linear interpolation:
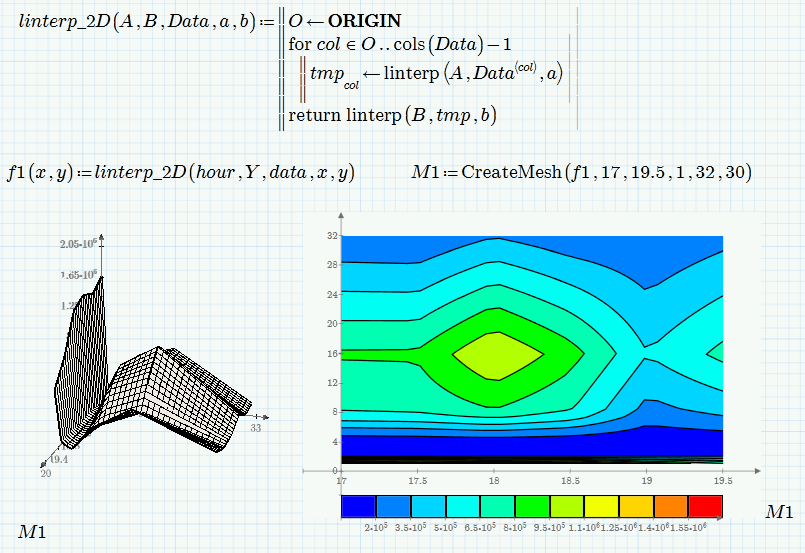
More sophistic is using splines for interpolation

Mathcad offer three different flavors for cubic splines - cspline, pspline, lspline.
As you can see, I used cspline. If you change that for lspline the result should be the very same as if using the built-in Bicubic2D.
There is a slight difference between the two as you can see in the attached sheet.
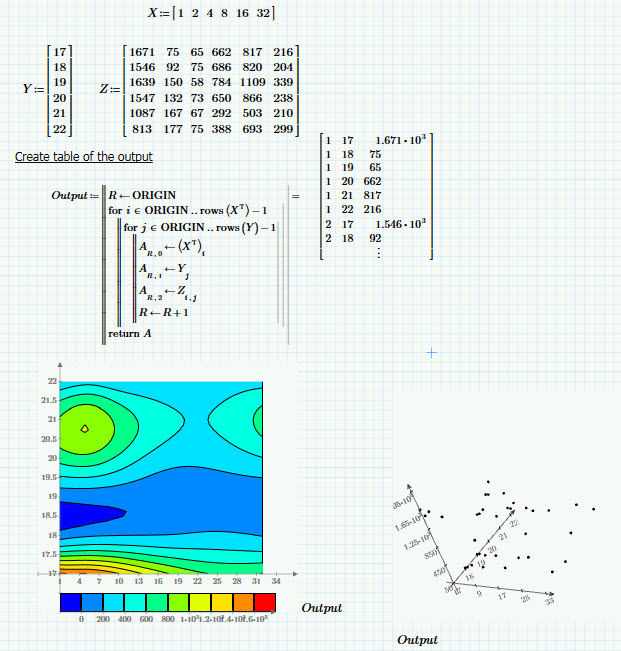
The data used by Mathcad to show a 3d surface is a little bit complicated and consists of three nested matrices. Here is a way to build that structure from row-, column-header and data table and then plot the pure data:

Attached file in format Prime 3.0.
P.S.: I am not sure what Fred intended as in fact he simply put two columns in front of the data table (accidentally overwriting the first data column) which means we plot wrong data, I guess.
dferry in his first reply (apart from using differently scaled data) simply created a three column matrix - a long list of points.
That way he is losing completely the mesh information - which point is neighbor of which.
I asked here in the past quite a few time if anybody would know which kind of function Mathcad would try to fit over just a bunch of data points if asked to do a surface plot (I think Prime refuses to do so, nevertheless happily provides a contour plot?). So far nobody could answer that question. What we know is that its not an interpolation but rather an approximation. The surface Mathcad creates usually does not include the datapoints exactly but rather follows them as good as it can (whatever that may mean).
Therefore I guess its not a good idea to abandon the mesh-information. Even though dferry did not create a surface plot in his first answer he showed a contour plot, which also would force Prime to create some kind of surface.

