
Turn on suggestions
Auto-suggest helps you quickly narrow down your search results by suggesting possible matches as you type.
Showing results for
Turn on suggestions
Auto-suggest helps you quickly narrow down your search results by suggesting possible matches as you type.
Showing results for
Community Tip - Did you know you can set a signature that will be added to all your posts? Set it here! X
Options
- Subscribe to RSS Feed
- Mark Topic as New
- Mark Topic as Read
- Float this Topic for Current User
- Bookmark
- Subscribe
- Mute
- Printer Friendly Page
Colour between curves
May 30, 2013
05:52 AM
- Mark as New
- Bookmark
- Subscribe
- Mute
- Subscribe to RSS Feed
- Permalink
- Notify Moderator
May 30, 2013
05:52 AM
Colour between curves
Please could someone show how to colour beteeen two curves.
see attached.
thanks
Jason
Solved! Go to Solution.
1 ACCEPTED SOLUTION
Accepted Solutions
May 30, 2013
08:36 AM
- Mark as New
- Bookmark
- Subscribe
- Mute
- Subscribe to RSS Feed
- Permalink
- Notify Moderator
May 30, 2013
08:36 AM
Here is a modified sheet
Hatch routine is basically the same, but shorter and I show a way to use it with a small data matrix utilizing your FIT() function.
12 REPLIES 12
May 30, 2013
06:37 AM
- Mark as New
- Bookmark
- Subscribe
- Mute
- Subscribe to RSS Feed
- Permalink
- Notify Moderator
May 30, 2013
06:37 AM
There is nothing built in, you would have to write your own routine to do so.
You might want to have a look at Prof. Birkeland's work here
May 30, 2013
06:49 AM
- Mark as New
- Bookmark
- Subscribe
- Mute
- Subscribe to RSS Feed
- Permalink
- Notify Moderator
May 30, 2013
06:49 AM
Ive managed to work out how to find the solution, but not yet do the shading.
Jason
May 30, 2013
06:51 AM
- Mark as New
- Bookmark
- Subscribe
- Mute
- Subscribe to RSS Feed
- Permalink
- Notify Moderator
May 30, 2013
06:54 AM
- Mark as New
- Bookmark
- Subscribe
- Mute
- Subscribe to RSS Feed
- Permalink
- Notify Moderator
May 30, 2013
06:54 AM
In MathCad 15 if you set up consecutive traces , you can colour an area (see attached)
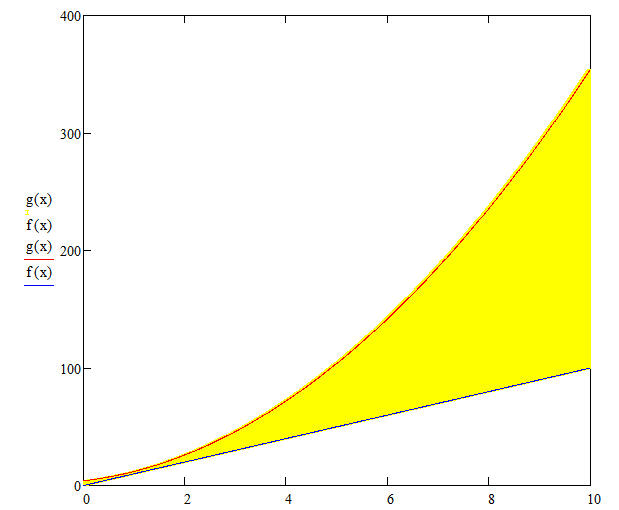
right click on the graph to bring up a pop-up menu , choose format.
On the next menu choose the traces tab & there are many formats you can set for the traces.
in this case setting error on traces 1 & 2.
Regards
Andy
May 30, 2013
07:26 AM
- Mark as New
- Bookmark
- Subscribe
- Mute
- Subscribe to RSS Feed
- Permalink
- Notify Moderator
May 30, 2013
07:26 AM
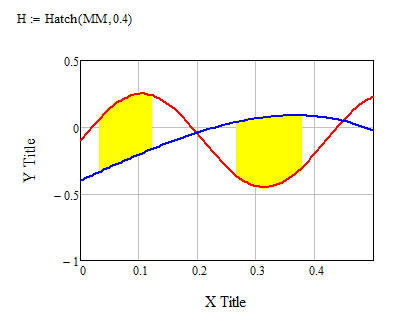
To limit the shading to the region where the difference between the two functions is greater than a given threshold would require some additional work. One way would be to determine which range of ordinate values the shading should be applied to and limit the first two functions in your plot to that range via a range variable. This is not atomatic and would not work if there are multiple ranges, though.
Also we have tabled functions here with a rather great stepwidth, so we would get four discrete vertical bars only.
But I assume this is a testcase only and that the real application would deal with a much more comprehensive data set with smaller steps.
Assuming that I include a worksheet which seems to do what the poster demands.
May 30, 2013
08:36 AM
- Mark as New
- Bookmark
- Subscribe
- Mute
- Subscribe to RSS Feed
- Permalink
- Notify Moderator
May 30, 2013
08:36 AM
Here is a modified sheet
Hatch routine is basically the same, but shorter and I show a way to use it with a small data matrix utilizing your FIT() function.
May 30, 2013
10:14 AM
- Mark as New
- Bookmark
- Subscribe
- Mute
- Subscribe to RSS Feed
- Permalink
- Notify Moderator
May 30, 2013
10:14 AM
How would you modify the DOTS function to work with my FIT() fucntion, i.e so the area between the curves was shaded with dots?
Thanks
Jason
May 30, 2013
10:57 AM
- Mark as New
- Bookmark
- Subscribe
- Mute
- Subscribe to RSS Feed
- Permalink
- Notify Moderator
May 30, 2013
10:57 AM
Jason Bryant wrote:
How would you modify the DOTS function to work with my FIT() fucntion, i.e so the area between the curves was shaded with dots?
Thanks
Jason
Not sure what you mean -I don't see a function DOTS() in your sheet!?
If you like dots, simply change the line style of the trace.
May 30, 2013
09:26 AM
- Mark as New
- Bookmark
- Subscribe
- Mute
- Subscribe to RSS Feed
- Permalink
- Notify Moderator
May 30, 2013
09:26 AM
I have used error bars to fill the space between curves.
May 30, 2013
09:41 AM
- Mark as New
- Bookmark
- Subscribe
- Mute
- Subscribe to RSS Feed
- Permalink
- Notify Moderator
May 30, 2013
09:41 AM
Fred Kohlhepp wrote:
I have used error bars to fill the space between curves.
Thats what Andy suggested above (http://communities.ptc.com/message/205905#205905)
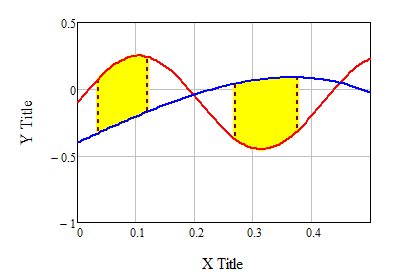
Doing it only on a selected range as demanded would require some additional work, though.
So for whatever its worth here's another version which allows marking the begin and end of the ranges of interest.
Feb 12, 2014
04:07 AM
- Mark as New
- Bookmark
- Subscribe
- Mute
- Subscribe to RSS Feed
- Permalink
- Notify Moderator
Feb 12, 2014
04:07 AM
I have only just came across this thread. superb work guys.
Feb 12, 2014
06:59 AM
- Mark as New
- Bookmark
- Subscribe
- Mute
- Subscribe to RSS Feed
- Permalink
- Notify Moderator
Feb 12, 2014
06:59 AM
Ahhh! Thats the thread I was searching and had in mind when in another thread someone recently asked how to shade the area between two curves. I'll link it here.

