
Turn on suggestions
Auto-suggest helps you quickly narrow down your search results by suggesting possible matches as you type.
Showing results for
Turn on suggestions
Auto-suggest helps you quickly narrow down your search results by suggesting possible matches as you type.
Showing results for
Community Tip - When posting, your subject should be specific and summarize your question. Here are some additional tips on asking a great question. X
Options
- Subscribe to RSS Feed
- Mark Topic as New
- Mark Topic as Read
- Float this Topic for Current User
- Bookmark
- Subscribe
- Mute
- Printer Friendly Page
Continuous Power Spectral Density (PSD) from a Discrete PSD
Feb 06, 2017
11:29 AM
- Mark as New
- Bookmark
- Subscribe
- Mute
- Subscribe to RSS Feed
- Permalink
- Notify Moderator
Feb 06, 2017
11:29 AM
Continuous Power Spectral Density (PSD) from a Discrete PSD
Hi everyone,
it is possible that I already posted a similar question in the past  , but this one is a slightly different problem. The physical background is the fatigue calculation derived from random vibration with a known PSD. There are many literature sources for that, I will just mention a good practical summary by Tom Irvine (hope the link will work), or just google "Estimating Fatigue Damage from Stress Power Spectral Density Function".
Now my problem is: the input for these approaches is always a continuous integrable function like for example this example from that paper:
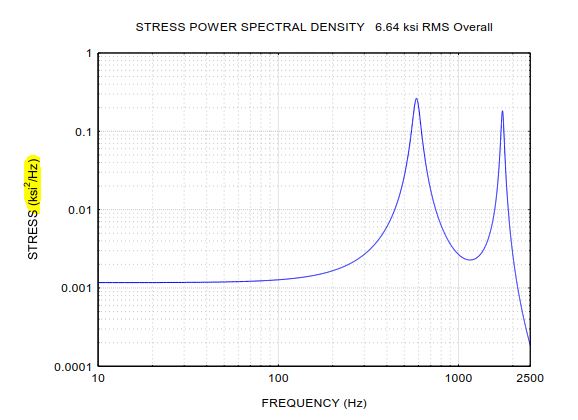
Obviously the units of these function are the square of the input quantity divided by Hz (for stress for example ksi**2/Hz or MPa**2/Hz). In this way the square root of the integral of the function will provide the RMS of the input quantity (in this example 6.64 ksi).
Now let's say I have a measured time signal (it is actually a vibration velocity, but it would be no problem to convert it in stress, so that is not the point). I use pspectrum (from the Signal Analysis Extension Pack) to compute its "discrete PSD". Using /cfft**2/ gives similar results, so the computation should be ok.
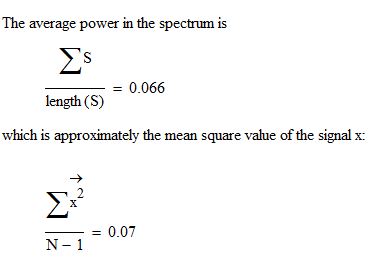
I say discrete, because while the sum of the "spectral lines" divided by their number is constant (and equal to the sum of the square of the input values, also divided by their number, see illustration from the "spectral analysis chapter of the e-book "Signal Analysis Extension Pack"),
well, now depending on the number of intervals that I chose, I get different "heights". Here an example:
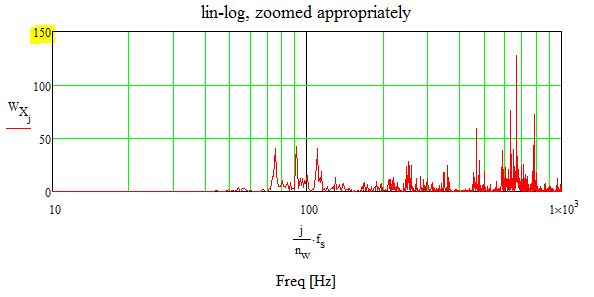
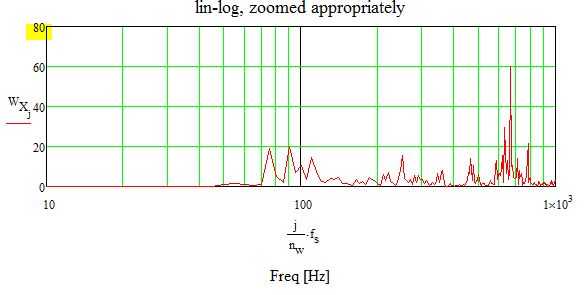
This is obvious, because the sum must remain constant, and so the function, though shown with a track, like it was continuous, is actually made from many vertical "lines" separated one from the other. In other words, the units of this psd output are (I believe) the square of the input quantity, and not, as in the analytical/numerical PSD example above, the quantity divided by Hz.
Now I would like to be able to fit some kind of envelope to the measured PSD, in order to do some computations, something like this:
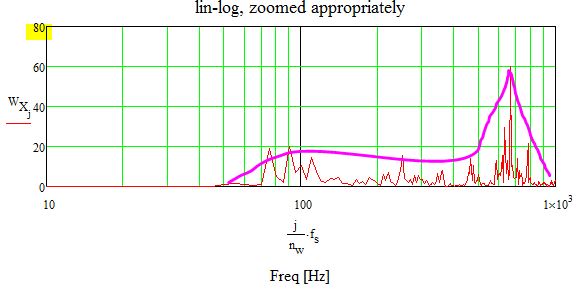
Possibly the integral of the fitted function should be only slightly above the RMS of the input signal, to avoid overconservativity, but that is another subject.
Now finally my question: how do I get the "right" units [MPa**2/Hz] or [ksi**2/Hz] on the vertical axis? It may be so a dummy question that the answer is: just divide the peaks by their frequency and that's it, but somehow I am unsure if that's all what I need to do.
Thanks a lot for any hints
Best regards
Claudio
Solved! Go to Solution.
Labels:
- Labels:
-
Calculus_Derivatives
1 ACCEPTED SOLUTION
Accepted Solutions
Feb 06, 2017
05:11 PM
- Mark as New
- Bookmark
- Subscribe
- Mute
- Subscribe to RSS Feed
- Permalink
- Notify Moderator
Feb 06, 2017
05:11 PM
Ah,... but that would mean that your spectrum gets 'attenuated' at high frequencies much more than at low frequencies.
So I could be wrong, and you just have to divide all sample values with the sampling frequency.
Success!
Luc.
10 REPLIES 10
Feb 06, 2017
03:15 PM
- Mark as New
- Bookmark
- Subscribe
- Mute
- Subscribe to RSS Feed
- Permalink
- Notify Moderator
Feb 06, 2017
03:15 PM
Hello Claudio Pedrazzi,
you could use the genfit function, as in Help of the Prime and that I present briefly, here below:
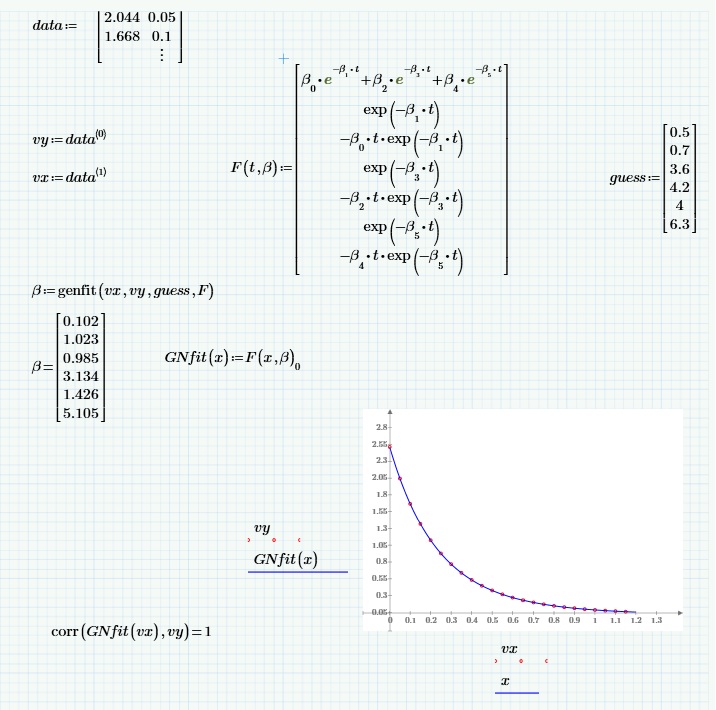
Greetings
F. M.
Feb 07, 2017
02:15 AM
- Mark as New
- Bookmark
- Subscribe
- Mute
- Subscribe to RSS Feed
- Permalink
- Notify Moderator
Feb 07, 2017
02:15 AM
Hi F.M., thanks a lot. I probably wrote too much and so the real question "disappeared" in the flood .
The "real question" is: how do I get from a pspectrum generated spectrum that has values in (for example) [ksi2] to a "normal" function having units of (for example) [ksi2/Hz].
But thanks for suggesting genfit, I will surely try it. But I have to get to the right numerical values before I can even start to fit.
Best regards
Claudio
Feb 06, 2017
05:07 PM
- Mark as New
- Bookmark
- Subscribe
- Mute
- Subscribe to RSS Feed
- Permalink
- Notify Moderator
Feb 06, 2017
05:07 PM
Hi Claudio,
The CFFT function produces the magnitude of the spectrum for each positive (>=0) frequency fn, where fn=Fs*n/N, where N is the total number of frequency points that you have.
And your Fs should be equal to the number of samples you took divided by the total observation time.
So I'd guess you divide each sample n by its Fn.
Hope this helps,
Luc
Feb 06, 2017
05:11 PM
- Mark as New
- Bookmark
- Subscribe
- Mute
- Subscribe to RSS Feed
- Permalink
- Notify Moderator
Feb 06, 2017
05:11 PM
Ah,... but that would mean that your spectrum gets 'attenuated' at high frequencies much more than at low frequencies.
So I could be wrong, and you just have to divide all sample values with the sampling frequency.
Success!
Luc.
Feb 07, 2017
02:17 AM
- Mark as New
- Bookmark
- Subscribe
- Mute
- Subscribe to RSS Feed
- Permalink
- Notify Moderator
Feb 07, 2017
02:17 AM
Exactly Luc, I do not know what is correct. I hope some expert will come out with the right method.
I will certainly try both anyway.
Regards
Claudio
Feb 07, 2017
04:38 AM
- Mark as New
- Bookmark
- Subscribe
- Mute
- Subscribe to RSS Feed
- Permalink
- Notify Moderator
Feb 07, 2017
04:38 AM
Claudio,
you may want to have a look at this Spectrum analyser, which I built a couple of years ago to have a Spectrum Analyser in Mathcad, to mimic a real-world spectrum analyser (eletronic equipment that you can use to investigate spectral properties of real world electrical signals).
I remember trying to deal with the units there, abut don't know if I was able to sort it out.
Unfortunately I'm limited in time now, so have no time to dig deeply into it.
Success!
Luc
Feb 10, 2017
09:01 PM
- Mark as New
- Bookmark
- Subscribe
- Mute
- Subscribe to RSS Feed
- Permalink
- Notify Moderator
Feb 10, 2017
09:01 PM
Claudio,
This thread is loosening up some rust in my brain. I had to cover this issue for an informal class some years ago, and I found the note I had written about this at that time, now attached. It may help with the issues that you are addressing.
Mathcad has a few different discrete Fourier transform functions. In my work with Mathcad (mostly Mathcad 11) as an engineer, I almost always used CFFT/ICFFT as these had the scaling I considered the most useful (CFFT/ICFFT use C1=1 in the language of the note).
Lou
Feb 13, 2017
02:26 AM
- Mark as New
- Bookmark
- Subscribe
- Mute
- Subscribe to RSS Feed
- Permalink
- Notify Moderator
Feb 13, 2017
02:26 AM
Hi Lou and Luc
this is just to say a big great thank you. At the moment I had to suspend working on this question, but as soon as I can come back, I will (after using your suggestions) also post here what I hope will be the answer working for me. Please excuse me if a little time goes by ...
Regards
Claudio
Feb 21, 2017
03:17 AM
- Mark as New
- Bookmark
- Subscribe
- Mute
- Subscribe to RSS Feed
- Permalink
- Notify Moderator
Feb 21, 2017
03:17 AM
So I am posting here, as usual, what is apparently working for me. I wished to use the "pspectrum" function because it is very general and has a few interesting input options, missing on cfft. For example the number of intervals, the optional windowing (you know, Hanning, Hamming, Rectangular, Tapered rectangular) and the fractional overlap.

Having said this, pspectrum provides the "power spectrum", per definition [Units: Signal**2]. So "obviously"  to obtain the "power spectral density" [Units: Signal**2/Hz] it has to be divided by the sampling frequency fs (and multiplied by two if one wants the "one sided" spectrum that makes sense in engineering applications.
psd = 2 * pspectrum / fs
(and use only the first half of the pspectrum output)
With this transformation I obtain a vector of psd points, that if integrated numerically for example with the trapeze integration rule, no matter what the frequency resolution, always correctly reproduces the variance of the original signal. I tested this with different values of n and r in the pspectrum input. With lowering frequency resolution the peaks become flatter and wider, but the integral remains constant, as wished. Here a few examples based on the same signal. Note the ordinate scaling is changing. The integral of the curve is approximately constant and numerically equal to the variance of the signal (sigma**2).
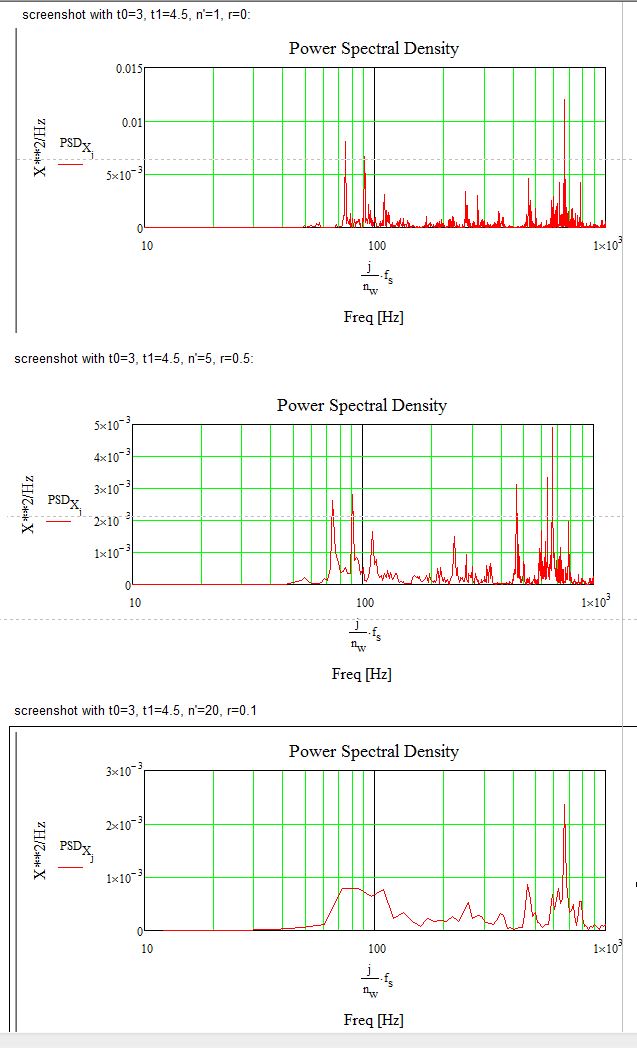
So I believe this should be the right approach. I would be grateful for further hints and of course if someone can point to an error in my reasoning.
Also, thank you again to all answerers, they are highly appreciated.
Best regards
Claudio
PS: LucMeekes I believe that the division by sampling frequency fs is correct, because if it was wrong I would not obtain the correct integral. Dividing by the frequency of each sample would "attenuate" the higher frequencies. Also cfft, after all, has to be squared and divided by fs, in order to produce the psd.
Feb 21, 2017
06:45 AM
- Mark as New
- Bookmark
- Subscribe
- Mute
- Subscribe to RSS Feed
- Permalink
- Notify Moderator
Feb 21, 2017
06:45 AM
Grazie mille, Claudio,
for sorting it out.
I guess I may have missed the factor of two, due to taking only the positive half of the spectrum.
Once I have more time , I'll check my spectrum analyser.
Chiao,
Luc

