
Turn on suggestions
Auto-suggest helps you quickly narrow down your search results by suggesting possible matches as you type.
Showing results for
Turn on suggestions
Auto-suggest helps you quickly narrow down your search results by suggesting possible matches as you type.
Showing results for
Community Tip - Want the oppurtunity to discuss enhancements to PTC products? Join a working group! X
Options
- Subscribe to RSS Feed
- Mark Topic as New
- Mark Topic as Read
- Float this Topic for Current User
- Bookmark
- Subscribe
- Mute
- Printer Friendly Page
Contour plots in Mathcad 15
May 15, 2013
09:12 PM
- Mark as New
- Bookmark
- Subscribe
- Mute
- Subscribe to RSS Feed
- Permalink
- Notify Moderator
May 15, 2013
09:12 PM
Contour plots in Mathcad 15
I can find no way in Mathcad 15 to indicate the value associated with a particular contour in a contour plot. Numbering can be turned on but that often leads to an undecipherable mess, particularly for experimental data that contains a noise component. I can find no way to add a strip of the colours used in the plot along with the numeric equivalent of each colour.
This makes Mathcad contour plots unusable for technical publications. The Mathcad data has to be exported to a more versatile plotting program. I suppose this is no different than other Mathcad plots that have all been ruled unacceptable by any technical journal our group has published in.
There have been many requests over the years for Mathcad to improve its plotting functionality to avoid the time consuming step of exporting Mathcad data, but they have all gone unheeded. There was a brief period of hope when Mathsoft purchased Axum, but that only resulted in the demise of Axum, but no improvements to Mathcad plotting functions.
Is Prime any better than Mathcad 15 in its plotting ability.
Labels:
- Labels:
-
Statistics_Analysis
3 REPLIES 3
May 15, 2013
09:33 PM
- Mark as New
- Bookmark
- Subscribe
- Mute
- Subscribe to RSS Feed
- Permalink
- Notify Moderator
May 15, 2013
09:33 PM
Is Prime any better than Mathcad 15 in its plotting ability.
Some minor things may be considered better looking, but there are other quirks. Wouldn't say that Prime's plots can be called publication quality.
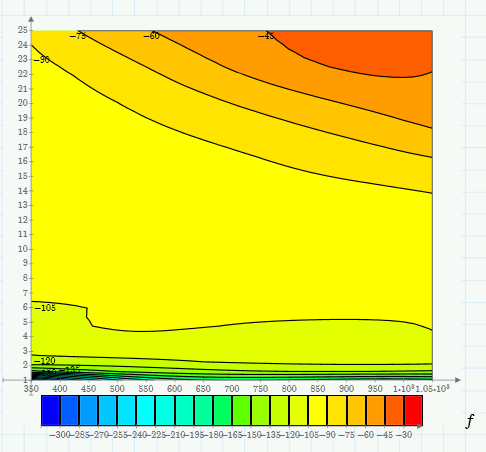
Regarding the contour plot you get at least your color strip legend.
See here a pic from a file of from recent thread ( http://communities.ptc.com/message/203136#203136)
May 16, 2013
12:35 AM
- Mark as New
- Bookmark
- Subscribe
- Mute
- Subscribe to RSS Feed
- Permalink
- Notify Moderator
May 16, 2013
12:35 AM
One example an using counter plot on Mathcad 14 server with your wishes:
http://twt.mpei.ac.ru/MCS/Worksheets/TMO/Pde-Temperature.xmcd
We can point on the counter plot the current point as crosshair.
May 16, 2013
07:41 PM
- Mark as New
- Bookmark
- Subscribe
- Mute
- Subscribe to RSS Feed
- Permalink
- Notify Moderator
May 16, 2013
07:41 PM
Thanks Valery and Werner that is just what I wanted. I don't have Prime installed and Valery's link didn't let me open the .xmcd file so I am still not sure how the colour caption was inserted. Is it just a second contour plot with the same maximum and minimum as the parent plot? It would be ver helpful if I could see the code?
Thanks Dave

