
Turn on suggestions
Auto-suggest helps you quickly narrow down your search results by suggesting possible matches as you type.
Showing results for
Turn on suggestions
Auto-suggest helps you quickly narrow down your search results by suggesting possible matches as you type.
Showing results for
Options
- Subscribe to RSS Feed
- Mark Topic as New
- Mark Topic as Read
- Float this Topic for Current User
- Bookmark
- Subscribe
- Mute
- Printer Friendly Page
Creating Countour Plots (i.e. plot contours of f(x,y)=C in xy-plane)
Jul 16, 2012
01:09 PM
- Mark as New
- Bookmark
- Subscribe
- Mute
- Subscribe to RSS Feed
- Permalink
- Notify Moderator
Jul 16, 2012
01:09 PM
Creating Countour Plots (i.e. plot contours of f(x,y)=C in xy-plane)
I have a worksheet right now that defines a function (concentration) as a function of x and y - call it "Cg(x,y)"
I am looking to plot contours of constant concentration in the xy-plane, that is to say, set Cg = 0.8, 0.6, etc. and plot the resulting contours on a x-y graph.
I am new to the community and a beginner, for the most part, to Mathcad, so I really don't know even where to start. It is not a function that could be solved symbolically, therefore I think it might have to be plotted as a series of sequential points. If anyone can help tell me how to create such contour plots, that would be very much appreciated. Thank you!
Solved! Go to Solution.
Labels:
- Labels:
-
Other
1 ACCEPTED SOLUTION
Accepted Solutions
Jul 16, 2012
02:59 PM
- Mark as New
- Bookmark
- Subscribe
- Mute
- Subscribe to RSS Feed
- Permalink
- Notify Moderator
Jul 16, 2012
02:59 PM
There are several values for which your cg function doesn't converge, and the contour plot function doesn't like this. I've replaced these with zero in the attached (this might or might not be acceptable to you) - see attached.
Also you needed to change the range of the Quickplot data.
Alan
7 REPLIES 7
Jul 16, 2012
01:55 PM
- Mark as New
- Bookmark
- Subscribe
- Mute
- Subscribe to RSS Feed
- Permalink
- Notify Moderator
Jul 16, 2012
01:55 PM
Something like this:
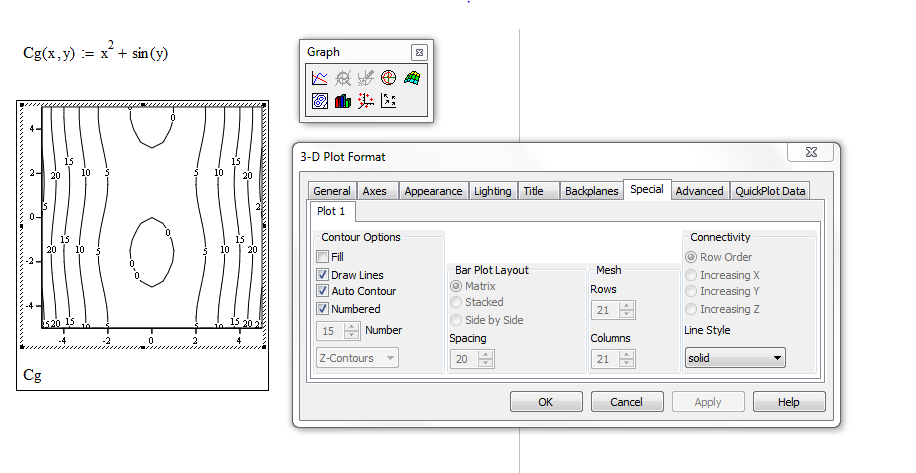
Alan
Jul 16, 2012
02:07 PM
- Mark as New
- Bookmark
- Subscribe
- Mute
- Subscribe to RSS Feed
- Permalink
- Notify Moderator
Jul 16, 2012
02:07 PM
Yes, that is precisely what I am looking for and figured out how to get that type of plot now, but how do I specify the countours I want? For instance in your plot you have contours of Cg(x,y)=0,5,10,15,20... plotted. I am looking to get contours of Cg(x,y)=0.9, 0.8, 0.7...
Jul 16, 2012
02:13 PM
- Mark as New
- Bookmark
- Subscribe
- Mute
- Subscribe to RSS Feed
- Permalink
- Notify Moderator
Jul 16, 2012
02:13 PM
Ethan Ambroziak wrote:
... I am looking to get contours of Cg(x,y)=0.9, 0.8, 0.7...
Try it with your function and see if Mathcad comes up with suitable values. I'm not sure you can specify exactly which values it must use!
Post your function (with the ranges of x and y of interest) and I (or someone else) might be able to produce something acceptable to you.
Alan
Jul 16, 2012
02:16 PM
- Mark as New
- Bookmark
- Subscribe
- Mute
- Subscribe to RSS Feed
- Permalink
- Notify Moderator
Jul 16, 2012
02:16 PM
I've attached my worksheet, you will find the equation and the intended plot near the bottom. Range of x and y shown on the plot are roughly what I am looking for. MathCAD did not seem to come up with suitable contour constants.
Jul 16, 2012
02:59 PM
- Mark as New
- Bookmark
- Subscribe
- Mute
- Subscribe to RSS Feed
- Permalink
- Notify Moderator
Jul 16, 2012
02:59 PM
There are several values for which your cg function doesn't converge, and the contour plot function doesn't like this. I've replaced these with zero in the attached (this might or might not be acceptable to you) - see attached.
Also you needed to change the range of the Quickplot data.
Alan
Jul 16, 2012
03:00 PM
- Mark as New
- Bookmark
- Subscribe
- Mute
- Subscribe to RSS Feed
- Permalink
- Notify Moderator
Jul 16, 2012
03:00 PM
You can use CreateMesh to create this lot. (attached) I can't quite get the ranges you were hoping for.
Jul 16, 2012
03:13 PM
- Mark as New
- Bookmark
- Subscribe
- Mute
- Subscribe to RSS Feed
- Permalink
- Notify Moderator
Jul 16, 2012
03:13 PM
Thanks guys, and yes I was able to figured out that I needed to change the QuickPlot data range soon after I posted my last reply. The solution not converging is not necessarily too inconvenient for me, to be honest I am just doing this worksheet for practice since I am just beginning to learn the program.
Thanks again for the help, guys! I know exactly where to come if I ever have any more important problems with MathCAD that I need solving!

