
Turn on suggestions
Auto-suggest helps you quickly narrow down your search results by suggesting possible matches as you type.
Showing results for
Turn on suggestions
Auto-suggest helps you quickly narrow down your search results by suggesting possible matches as you type.
Showing results for
Options
- Subscribe to RSS Feed
- Mark Topic as New
- Mark Topic as Read
- Float this Topic for Current User
- Bookmark
- Subscribe
- Mute
- Printer Friendly Page
Creating the “enveloping” ellipse for a Monte Carlo plot?
Sep 20, 2018
08:52 AM
- Mark as New
- Bookmark
- Subscribe
- Mute
- Subscribe to RSS Feed
- Permalink
- Notify Moderator
Sep 20, 2018
08:52 AM
Creating the “enveloping” ellipse for a Monte Carlo plot?
To all
I am doing my 1st step with the montecarlo() function in mcad 15. I copied the example and put my own function and it seems to work fine.
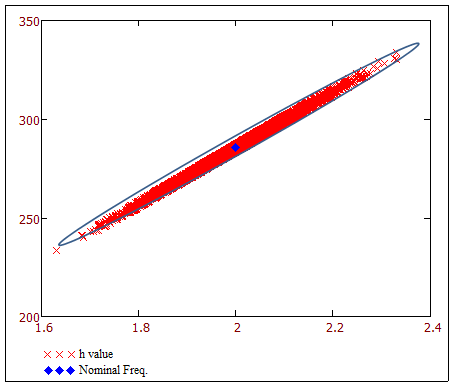
Does anyone know if there is a way of getting/creating the “enveloping” ellipse one often sees on a Monte Carlo plot? I attached one on which I drew the ellipse
I think the length of the minor and major axis have a meaning (in the Mont Carlo world) byut can’t quite remember what it is!
Solved! Go to Solution.
Labels:
- Labels:
-
Programming
1 ACCEPTED SOLUTION
Accepted Solutions
Sep 25, 2018
06:48 AM
- Mark as New
- Bookmark
- Subscribe
- Mute
- Subscribe to RSS Feed
- Permalink
- Notify Moderator
Sep 25, 2018
06:48 AM
Get the mean data X0 =(x0,y0)
Get pts
1: X1=(x1,y1) x1=min(x), y(x1)
2: X2=(x2,y2) x2=max(x), y(x2)
Centre of the ellipse is X0
Major axis a =|| X2-X1||
Rotation angle of the ellipse atan(|X2|/|X1|)
Search minor axis (b) to envelope all the pts
Plot ellipse translated by X0 and rotated by alpha
11 REPLIES 11
Sep 25, 2018
06:48 AM
- Mark as New
- Bookmark
- Subscribe
- Mute
- Subscribe to RSS Feed
- Permalink
- Notify Moderator
Sep 25, 2018
06:48 AM
Get the mean data X0 =(x0,y0)
Get pts
1: X1=(x1,y1) x1=min(x), y(x1)
2: X2=(x2,y2) x2=max(x), y(x2)
Centre of the ellipse is X0
Major axis a =|| X2-X1||
Rotation angle of the ellipse atan(|X2|/|X1|)
Search minor axis (b) to envelope all the pts
Plot ellipse translated by X0 and rotated by alpha
Sep 25, 2018
08:52 AM
- Mark as New
- Bookmark
- Subscribe
- Mute
- Subscribe to RSS Feed
- Permalink
- Notify Moderator
Sep 25, 2018
08:52 AM
And the minor axis is?
Sep 25, 2018
09:18 AM
- Mark as New
- Bookmark
- Subscribe
- Mute
- Subscribe to RSS Feed
- Permalink
- Notify Moderator
Sep 25, 2018
09:18 AM
Haven’t quite work this out in detail – I thought I had something !
I know that it is a vector normal to a =|| X2-X1|| and must be of such length as to enclosed all (most) of the points
Some of steps work fine in a stand-alone example but not when I try to integrate it to the monte-carlo plot
So kind of a step back !
Sep 25, 2018
09:29 AM
- Mark as New
- Bookmark
- Subscribe
- Mute
- Subscribe to RSS Feed
- Permalink
- Notify Moderator
Sep 25, 2018
09:29 AM
How about this?
You've calculated the angle for the major axis. (I liked what you've got so far.
Now
Rotate all of the data so that the major axis is parallel to the x axis.
Then the length of the minor axis is max(y)-min(y). And the minor axis is normal to the major axis, so you know the whole ellipse.
Sep 25, 2018
09:45 AM
- Mark as New
- Bookmark
- Subscribe
- Mute
- Subscribe to RSS Feed
- Permalink
- Notify Moderator
Sep 25, 2018
09:45 AM
Indeed
so I need to rotate each pair of data (from the data set from the montcarlo output)
data=augment(hv,R)
(where hv is the variable and R1 the output of the montcarlo)
if Rz is the rotation matrix (anticlockwise)
datarotate=(Rz(-beta)*data^T)^T
where beta is the angle for the major axis
Cannot plot this ! so must work on each set of data
Working on a cut-down version of the test sheet to post
Sep 25, 2018
11:13 AM
- Mark as New
- Bookmark
- Subscribe
- Mute
- Subscribe to RSS Feed
- Permalink
- Notify Moderator
Sep 25, 2018
11:48 AM
- Mark as New
- Bookmark
- Subscribe
- Mute
- Subscribe to RSS Feed
- Permalink
- Notify Moderator
Sep 25, 2018
11:48 AM
Thanks
Why is there no way of rotating the "scatter" data M(x,y) using a rotation matrix?
Mrot(x',y') = R(alpha).M(x',y')
Sep 25, 2018
02:05 PM
- Mark as New
- Bookmark
- Subscribe
- Mute
- Subscribe to RSS Feed
- Permalink
- Notify Moderator
Sep 25, 2018
02:05 PM
@JBlackhole wrote:
Thanks
Why is there no way of rotating the "scatter" data M(x,y) using a rotation matrix?
Mrot(x',y') = R(alpha).M(x',y')
There is; you'd need to have the data paired (x,y) rather than two separate vectors.
Sep 26, 2018
06:00 PM
- Mark as New
- Bookmark
- Subscribe
- Mute
- Subscribe to RSS Feed
- Permalink
- Notify Moderator
Sep 26, 2018
06:00 PM
Here's a solution that uses Minimize to make an ellipse of minimum area that includes all the points. Seems to work.

4.0/pdf attached
Sep 27, 2018
06:01 AM
- Mark as New
- Bookmark
- Subscribe
- Mute
- Subscribe to RSS Feed
- Permalink
- Notify Moderator
Sep 27, 2018
06:01 AM
Thanks for that.
Thanks to Fred and yourself for the input. Really appreciated
Sep 27, 2018
08:26 AM
- Mark as New
- Bookmark
- Subscribe
- Mute
- Subscribe to RSS Feed
- Permalink
- Notify Moderator
Sep 27, 2018
08:26 AM
VERY NICE!!

