
Turn on suggestions
Auto-suggest helps you quickly narrow down your search results by suggesting possible matches as you type.
Showing results for
Turn on suggestions
Auto-suggest helps you quickly narrow down your search results by suggesting possible matches as you type.
Showing results for
Options
- Subscribe to RSS Feed
- Mark Topic as New
- Mark Topic as Read
- Float this Topic for Current User
- Bookmark
- Subscribe
- Mute
- Printer Friendly Page
Definign a "Safe Zone" with graph
Feb 10, 2014
10:02 AM
- Mark as New
- Bookmark
- Subscribe
- Mute
- Subscribe to RSS Feed
- Permalink
- Notify Moderator
Feb 10, 2014
10:02 AM
Definign a "Safe Zone" with graph
to all
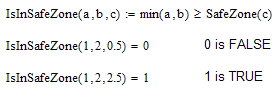
I am trying to figure out a way of checking that a specified value (min of values a & b) is in a "safe zone". Is there a way of doing this is in a smart way?
See attached
Thanks
Regards
JXB
Solved! Go to Solution.
Labels:
- Labels:
-
Other
1 ACCEPTED SOLUTION
Accepted Solutions
Feb 10, 2014
01:13 PM
- Mark as New
- Bookmark
- Subscribe
- Mute
- Subscribe to RSS Feed
- Permalink
- Notify Moderator
Feb 10, 2014
01:13 PM
Werner
Thanks for the reply. You are right about the area above 1.5 for c < 1. I was doing one thing at the time. Startin with the easy bit!
5 REPLIES 5
Feb 10, 2014
10:42 AM
- Mark as New
- Bookmark
- Subscribe
- Mute
- Subscribe to RSS Feed
- Permalink
- Notify Moderator
Feb 10, 2014
10:42 AM
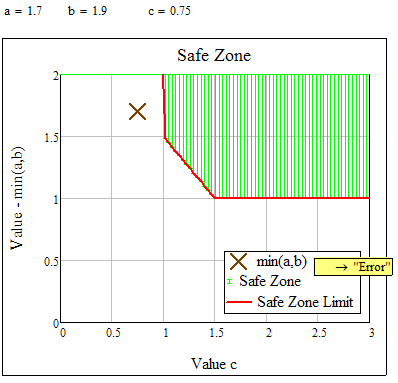
One single value can't be in your zone - your safe zone is a twodimensional area, so you would need two coordinates to check if a given point is in the safe zone.
Maybe something like the following will do what you are searching for
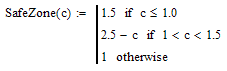
BTW, your function SafeZone() has an error (2nd line) which does not show up in the plot because of the large stepwith (0.5) of your range cvalue
Feb 10, 2014
10:48 AM
- Mark as New
- Bookmark
- Subscribe
- Mute
- Subscribe to RSS Feed
- Permalink
- Notify Moderator
Feb 10, 2014
10:48 AM
Thanks Werner. Spotted the error after posting the file
Teh attached (SZ) seems to be working!
Feb 10, 2014
12:09 PM
- Mark as New
- Bookmark
- Subscribe
- Mute
- Subscribe to RSS Feed
- Permalink
- Notify Moderator
Feb 10, 2014
12:09 PM
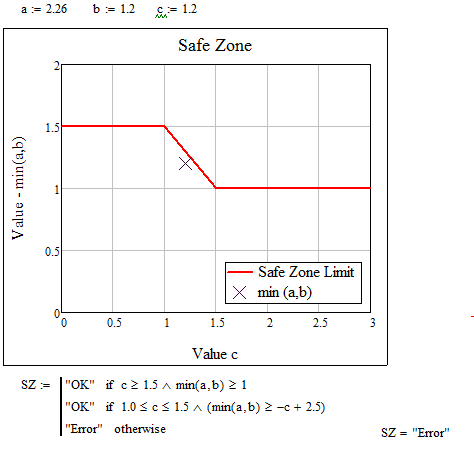
As you had already defined your function SafeZone, I would't redefine the same function again in SZ but rather use the already defined function. Furthermore I'd prefer a function to yield the OK or Error message, so you could evaluate for different triples of values in the same sheet at the same time.
Your calculation of SZ does not consider the area above 1.5 for 0<c<1 as safe. But your safe zone limit graph suggest that this area IS safe. If its not you would have to change your function SafeZone, replacing the top 1.5 by infinity (ctrl-shift-z):
Feb 10, 2014
01:13 PM
- Mark as New
- Bookmark
- Subscribe
- Mute
- Subscribe to RSS Feed
- Permalink
- Notify Moderator
Feb 10, 2014
01:13 PM
Werner
Thanks for the reply. You are right about the area above 1.5 for c < 1. I was doing one thing at the time. Startin with the easy bit!
Feb 10, 2014
01:55 PM
- Mark as New
- Bookmark
- Subscribe
- Mute
- Subscribe to RSS Feed
- Permalink
- Notify Moderator
Feb 10, 2014
01:55 PM
So you found what you needed in one of the two files?

