
Turn on suggestions
Auto-suggest helps you quickly narrow down your search results by suggesting possible matches as you type.
Showing results for
Turn on suggestions
Auto-suggest helps you quickly narrow down your search results by suggesting possible matches as you type.
Showing results for
Options
- Subscribe to RSS Feed
- Mark Topic as New
- Mark Topic as Read
- Float this Topic for Current User
- Bookmark
- Subscribe
- Mute
- Printer Friendly Page
Equal axes in contour plots
Jun 20, 2014
11:36 AM
- Mark as New
- Bookmark
- Subscribe
- Mute
- Subscribe to RSS Feed
- Permalink
- Notify Moderator
Jun 20, 2014
11:36 AM
Equal axes in contour plots
Hello,
Is there a way to make the axes equal in a contour plot? I'd like to plot some data as a contour plot but the kept the scales equal so it is easy to interpret.
Is this possible?
Thanks
George
Labels:
- Labels:
-
Statistics_Analysis
11 REPLIES 11
Jun 20, 2014
11:47 AM
- Mark as New
- Bookmark
- Subscribe
- Mute
- Subscribe to RSS Feed
- Permalink
- Notify Moderator
Jun 20, 2014
11:47 AM
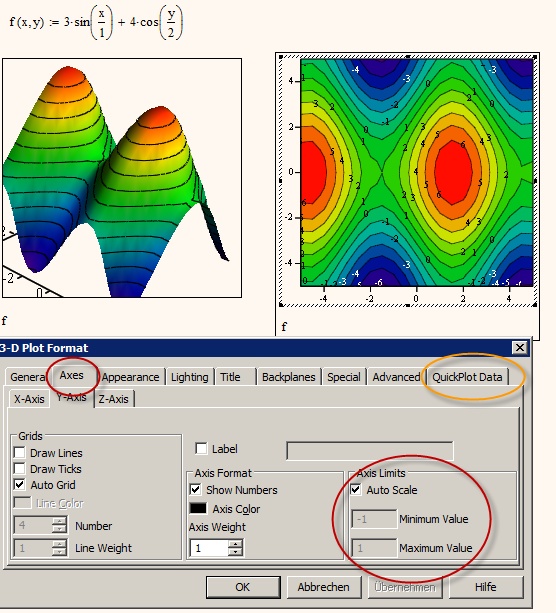
There is no option to do this automatically for you like in the 2D plot. But you can change the range to be plotted either on the Quickplot tab in the 3D-Plot-Format menu or via CreateMesh() (whatever you use). On the Axes tab you have the option to turn Auto Scale off and scale the plot yourself the way you like.
Jun 20, 2014
04:08 PM
- Mark as New
- Bookmark
- Subscribe
- Mute
- Subscribe to RSS Feed
- Permalink
- Notify Moderator
Jun 20, 2014
04:08 PM
If you provide some typical data I'm sure a simple program could be developed to scale the axis.
Jun 20, 2014
04:43 PM
- Mark as New
- Bookmark
- Subscribe
- Mute
- Subscribe to RSS Feed
- Permalink
- Notify Moderator
Jun 20, 2014
04:43 PM
First we should at least know what version of Mathcad is in use.
Jun 20, 2014
04:50 PM
- Mark as New
- Bookmark
- Subscribe
- Mute
- Subscribe to RSS Feed
- Permalink
- Notify Moderator
Jun 20, 2014
04:50 PM
True
Jun 21, 2014
07:42 AM
- Mark as New
- Bookmark
- Subscribe
- Mute
- Subscribe to RSS Feed
- Permalink
- Notify Moderator
Jun 21, 2014
07:42 AM
Hello, thank you for the responses. I'm using Mathcad 15.
I've tried unticking the autoscale button. If I make the scales the same size by setting the minimum and maximum will that do what I want? I thought I had to control the size of the plot window as well, because I could set the axes and then manually drag the window into a different size.
My end goal is to make some scale images of the data that I can superimpose on some geometry.
Thanks
George
Jun 21, 2014
07:44 AM
- Mark as New
- Bookmark
- Subscribe
- Mute
- Subscribe to RSS Feed
- Permalink
- Notify Moderator
Jun 21, 2014
07:44 AM
Please provide a worksheet for us to work with.
Jun 21, 2014
08:01 AM
- Mark as New
- Bookmark
- Subscribe
- Mute
- Subscribe to RSS Feed
- Permalink
- Notify Moderator
Jun 21, 2014
08:01 AM
Yes, you have to size the window manually after you have scaled the axis. Unfortunately the parameter of the 3d plot format cannot be controlled by Mathcad variables. You can of course set the axis limits once and drag the window so it looks equally scaled. But the various functions you wish to show would then have to fit within those limits.
A short time ago there was a thread where an old approach of Stuart was discussed. He found a way to change the parameters of a 3D plot using a scripted component. Maybe of interest to you.
But as Mike already wrote, it would be a good idea if you provide a worksheet with examples so we can see what you are doing (we don't know how you provide the functions to the 3D plot) and what you are looking for.
Jun 21, 2014
08:16 AM
- Mark as New
- Bookmark
- Subscribe
- Mute
- Subscribe to RSS Feed
- Permalink
- Notify Moderator
Jun 21, 2014
08:16 AM
Thanks for the responses, I'll post the work sheet when I get back to work on Monday.
I've created the contour plot by creating three vectors by reading in data files for each vector. The x values are in the first vector, the y values are in the second vector and the z values are in the third vector. I then create a plot of (x,y,z)
Jun 21, 2014
09:16 AM
- Mark as New
- Bookmark
- Subscribe
- Mute
- Subscribe to RSS Feed
- Permalink
- Notify Moderator
Jun 21, 2014
09:16 AM
Just three vectors? That would define just a number of points in 3D, maybe a curve, but sure not a surface you could plot a countour plot of!
Its just like you provide a bunch of points in 2D but no order to connect them. You can draw the point, but no curve. You have to provide the antecessor and the successor for every point to be able to draw a curve.
Similar in 3D: you would need some kind of 2D-order, define the four neighbours for every point in space. In other words you have to provide some kind of grid. Somethink like the data structure created by CreateMesh(). Thats a vector consisting of three matrices (2D!), one for every coordinate (x,y,z).
Jun 21, 2014
02:18 PM
- Mark as New
- Bookmark
- Subscribe
- Mute
- Subscribe to RSS Feed
- Permalink
- Notify Moderator
Jun 21, 2014
02:18 PM
The way I've done it is to create three vectors, all the same length. x1 to xn, y1 to yn and z1 to zn.
The at point (x1,y1) z1 is the variable I wish to produce a contour map.This is how I've defined the grid of points.
There are probably better ways to do it but my data is already in this format and the contour plot appears as I would expect it to.
Jun 21, 2014
06:42 PM
- Mark as New
- Bookmark
- Subscribe
- Mute
- Subscribe to RSS Feed
- Permalink
- Notify Moderator
Jun 21, 2014
06:42 PM
and the contour plot appears as I would expect it to.
I may look similar to what you expect, but I doubt its correct. Make the contour plot a surface plot and then plot the same three vectors as scatter plot (this time you see the single points). You will notice that the points are not on the surface plotted. So the surface probably is not the exact surface you want the contourplot be plotted of.
We had a similar probleme here a while ago http://communities.ptc.com/message/244950#244950
You might find that thread useful for your problem, too.

