
Turn on suggestions
Auto-suggest helps you quickly narrow down your search results by suggesting possible matches as you type.
Showing results for
Turn on suggestions
Auto-suggest helps you quickly narrow down your search results by suggesting possible matches as you type.
Showing results for
Community Tip - Learn all about PTC Community Badges. Engage with PTC and see how many you can earn! X
Options
- Subscribe to RSS Feed
- Mark Topic as New
- Mark Topic as Read
- Float this Topic for Current User
- Bookmark
- Subscribe
- Mute
- Printer Friendly Page
Error in 3D plot
Nov 08, 2014
03:49 AM
- Mark as New
- Bookmark
- Subscribe
- Mute
- Subscribe to RSS Feed
- Permalink
- Notify Moderator
Nov 08, 2014
03:49 AM
Error in 3D plot
Hi
I'm trying to make a 3D plot, but gets the error "The function did not evaluate to a pure real value".
I don't understand this, since the function seems to work just fine, when I enter values into it.
Solved! Go to Solution.
1 ACCEPTED SOLUTION
Accepted Solutions
Nov 08, 2014
04:07 AM
- Mark as New
- Bookmark
- Subscribe
- Mute
- Subscribe to RSS Feed
- Permalink
- Notify Moderator
Nov 08, 2014
04:07 AM
You have some divide by zeros and some imaginary numbers for certain values of du and cu.
A quick and dirty solution is provided in the attached, but you should really investigate the root cause and modify your function accordingly.
Alan
6 REPLIES 6
Nov 08, 2014
04:07 AM
- Mark as New
- Bookmark
- Subscribe
- Mute
- Subscribe to RSS Feed
- Permalink
- Notify Moderator
Nov 08, 2014
04:07 AM
You have some divide by zeros and some imaginary numbers for certain values of du and cu.
A quick and dirty solution is provided in the attached, but you should really investigate the root cause and modify your function accordingly.
Alan
Nov 08, 2014
04:43 AM
- Mark as New
- Bookmark
- Subscribe
- Mute
- Subscribe to RSS Feed
- Permalink
- Notify Moderator
Nov 08, 2014
04:43 AM
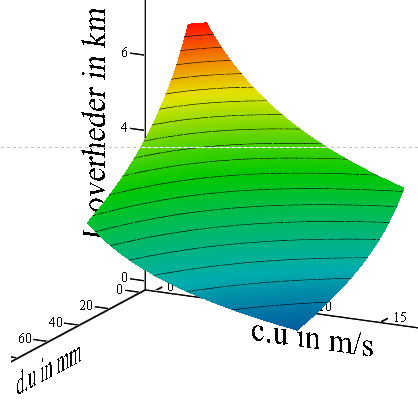
Thanks. I see the problem now. I'm really only interested in values of du >= 30 mm and cu >= 6 m/s.
I've tried to get that in the plot, but even though there is no error anymore, it doesn't plot anything.
I've never worked with 3D plots before so please excuse me if I'm being ignorant here.
Nov 08, 2014
07:08 AM
- Mark as New
- Bookmark
- Subscribe
- Mute
- Subscribe to RSS Feed
- Permalink
- Notify Moderator
Nov 08, 2014
07:08 AM
Ole Møller Christensen wrote:
Thanks. I see the problem now. I'm really only interested in values of du >= 30 mm and cu >= 6 m/s.
In that case you won't run into problems like divison by zero. You can change the range for the two arguments in the 3D plot format menu (double click on the plot) - Quickplot data. But you can be sure about the units you see in the plot then (probably the values get interpreted as meter not millimeter). So I would suggest you create a unitless version of that function (Lunitless(x,y):=L.over(x*mm,y*m/s)*1/km) and plot this. For more convenience you may also use CreateMesh so you don't have to set the limits in the forma menu.
EDIT: FOrgot to attach the sheet.
Nov 08, 2014
07:29 AM
- Mark as New
- Bookmark
- Subscribe
- Mute
- Subscribe to RSS Feed
- Permalink
- Notify Moderator
Nov 08, 2014
07:29 AM
Thanks. Then range was the problem. Now it works very fine.
Nov 08, 2014
07:47 AM
- Mark as New
- Bookmark
- Subscribe
- Mute
- Subscribe to RSS Feed
- Permalink
- Notify Moderator
Nov 08, 2014
07:47 AM
Ole Møller Christensen wrote:
Thanks. Then range was the problem. Now it works very fine.
Yes, but the values may be interpreted in base units when you use the quickplot feature, So be careful and look at the maginitude of the values at the z-axis.
Nov 08, 2014
07:33 AM
- Mark as New
- Bookmark
- Subscribe
- Mute
- Subscribe to RSS Feed
- Permalink
- Notify Moderator
Nov 08, 2014
07:33 AM
Like the attached then.
Alan
I see Werner's beaten me to it!

