
Turn on suggestions
Auto-suggest helps you quickly narrow down your search results by suggesting possible matches as you type.
Showing results for
Turn on suggestions
Auto-suggest helps you quickly narrow down your search results by suggesting possible matches as you type.
Showing results for
Community Tip - Your Friends List is a way to easily have access to the community members that you interact with the most! X
Options
- Subscribe to RSS Feed
- Mark Topic as New
- Mark Topic as Read
- Float this Topic for Current User
- Bookmark
- Subscribe
- Mute
- Printer Friendly Page
Fermi integral (01)
Dec 03, 2017
08:36 PM
- Mark as New
- Bookmark
- Subscribe
- Mute
- Subscribe to RSS Feed
- Permalink
- Notify Moderator
Dec 03, 2017
08:36 PM
Fermi integral (01)
Hello All,
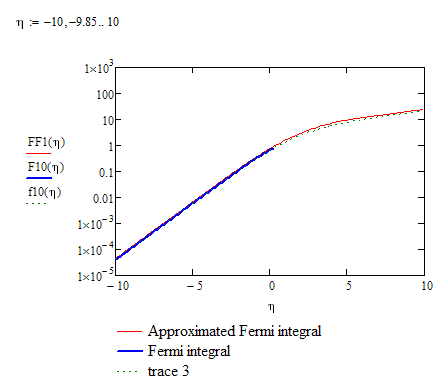
I am trying to calculate the Fermi integral of the order of 1/2 and its derivative. In the attached worksheet, the integral cannot be evaluated for x>0. I used an approximated model as is given in the following article but the result is not similar to what the article obtained.
Koroleva, Olga & V Mazhukin, A & Mazhukin, Vladimir & Breslavskiy, Pavel. (2016). APPROXIMATION OF FERMI-DIRAC INTEGRALS OF DIFFERENT ORDERS USED TO DETERMINE THE THERMAL PROPERTIES OF METALS AND SEMICONDUCTORS. MATHEMATICA MONTISNIGRI. 36. 37-53.
Could you please help me with this problem.
Thank you very much in advance.
Payman
Solved! Go to Solution.
Labels:
- Labels:
-
Calculus_Derivatives
1 ACCEPTED SOLUTION
Accepted Solutions
Dec 03, 2017
11:15 PM
- Mark as New
- Bookmark
- Subscribe
- Mute
- Subscribe to RSS Feed
- Permalink
- Notify Moderator
Dec 03, 2017
11:15 PM
To get single values you may consider using symbolic evaluation with "float"

For numeric approximation (for plotting) you may also use the same integral with a rather high upper value (not sure in which range this would be an acceptable approximation)

And to make your plot to math the one you try to duplicate you will have to
- not use the secondary y-axis (otherwise you will have different y scales)
- set the plot-limits manually
- notice, that the plot in the article uses a logarithmic y-scale

6 REPLIES 6
Dec 03, 2017
11:15 PM
- Mark as New
- Bookmark
- Subscribe
- Mute
- Subscribe to RSS Feed
- Permalink
- Notify Moderator
Dec 03, 2017
11:15 PM
To get single values you may consider using symbolic evaluation with "float"
For numeric approximation (for plotting) you may also use the same integral with a rather high upper value (not sure in which range this would be an acceptable approximation)
And to make your plot to math the one you try to duplicate you will have to
- not use the secondary y-axis (otherwise you will have different y scales)
- set the plot-limits manually
- notice, that the plot in the article uses a logarithmic y-scale
Dec 03, 2017
11:37 PM
- Mark as New
- Bookmark
- Subscribe
- Mute
- Subscribe to RSS Feed
- Permalink
- Notify Moderator
Dec 03, 2017
11:37 PM
This is the second time I noticed it - I am not offered the option to edit my post in the 3 dots menu. Anybody else having the same problem?
Just wanted to add, that you don't need to define eta as a vector and create the vectors for FF, etc.. A simple range is all thats neeed and if you are happy with the default range from -10 to 10 of the quickplot feature, you may also omit the range defintion altogether.

Dec 04, 2017
09:06 AM
- Mark as New
- Bookmark
- Subscribe
- Mute
- Subscribe to RSS Feed
- Permalink
- Notify Moderator
Dec 04, 2017
09:06 AM
Thank you very much Werner !
I don't know why, but my worksheet is still unable to perform the integration as you showed in your post. Could you please take a look?
Dec 04, 2017
12:42 PM
- Mark as New
- Bookmark
- Subscribe
- Mute
- Subscribe to RSS Feed
- Permalink
- Notify Moderator
Dec 04, 2017
12:42 PM
I have no idea whats going on. You file failed for me, too. But when I retyped the definition for F10 the very same way you did, it worked - no clue why. I attach the file - hope it works at your end, too.

Dec 04, 2017
12:57 PM
- Mark as New
- Bookmark
- Subscribe
- Mute
- Subscribe to RSS Feed
- Permalink
- Notify Moderator
Dec 04, 2017
12:57 PM
I really wonder what the reason for the error is if we feed the function defined with upper limit infinity with values higher than the one shown in the picture below

Dec 04, 2017
07:07 PM
- Mark as New
- Bookmark
- Subscribe
- Mute
- Subscribe to RSS Feed
- Permalink
- Notify Moderator
Dec 04, 2017
07:07 PM
Thank you, Werner, I really appreciate your help. I can now proceed forward.

