Community Tip - Want the oppurtunity to discuss enhancements to PTC products? Join a working group! X
- Subscribe to RSS Feed
- Mark Topic as New
- Mark Topic as Read
- Float this Topic for Current User
- Bookmark
- Subscribe
- Mute
- Printer Friendly Page
Find an equation of a curve between two known curves
- Mark as New
- Bookmark
- Subscribe
- Mute
- Subscribe to RSS Feed
- Permalink
- Notify Moderator
Find an equation of a curve between two known curves
I have two data sets that I can curve fit to get polynomial equations for. These are 2D data sets for temperatures of 23C nd 65C. I want to find the equation of a curve at 52C based on these two curves. I could interpolate between each value and generate a new data set piece by piece, but hopefully there is a better solution? Any help woudl be greatly appreciated. The data sets are attached in Prime 6.0
Thanks in advance!
Solved! Go to Solution.
- Labels:
-
Algebra_Geometry
-
Statistics_Analysis
Accepted Solutions
- Mark as New
- Bookmark
- Subscribe
- Mute
- Subscribe to RSS Feed
- Permalink
- Notify Moderator
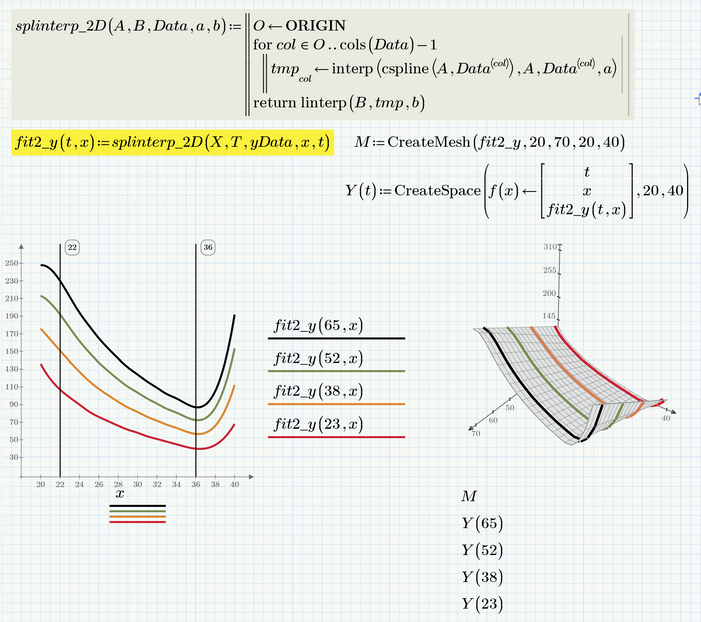
I added spline interpolation to give you an idea what it looks like and why I suggested to stay with linear interpolation.
You could change "cspline" to "lspline" for a less oscillating curve, but I guess that there is no benefit in using spline interpolation.
Remark: You talked about "polynomial fit" and even though I called my function (wrongly) "fit" it is NOT a fit but rather an interpolation, no matter if linear or spline. A polynomial fit could be obtained using polyfit, but the resulting curve normally would not run through a single single one of the 15 given data points (unless you chose a polynomial of order 14) but will be a good overall fit. Here an example to fit the data with a simple quadratic parabola:
One additional remark: Luckily the x values were the same for both data sets (vx=vx65). If the data would have been sampled at different x values, an additional step would have been necessary.
Modified P6 worksheet attached
- Mark as New
- Bookmark
- Subscribe
- Mute
- Subscribe to RSS Feed
- Permalink
- Notify Moderator
- Mark as New
- Bookmark
- Subscribe
- Mute
- Subscribe to RSS Feed
- Permalink
- Notify Moderator
- Mark as New
- Bookmark
- Subscribe
- Mute
- Subscribe to RSS Feed
- Permalink
- Notify Moderator
Hello Valerie,
That looks like it might be a good solution, but seems more obscure to me as I am not a MathCAD power user.
Thank you for helping!
- Mark as New
- Bookmark
- Subscribe
- Mute
- Subscribe to RSS Feed
- Permalink
- Notify Moderator
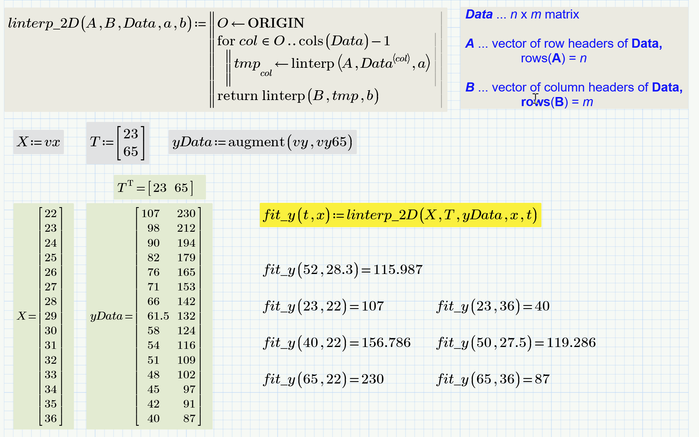
Here is an utility function you might find useful.
It uses linear interpolation only and I think thats all you need as you don't gain any value by spline interpolation. But of course it would be easy to replace the linear interpolation by a spline interpolation. Only the first one, as for the temperature you would have to stay with linear interpolation as you only have two values.
P6 worksheet attached
- Mark as New
- Bookmark
- Subscribe
- Mute
- Subscribe to RSS Feed
- Permalink
- Notify Moderator
I added spline interpolation to give you an idea what it looks like and why I suggested to stay with linear interpolation.
You could change "cspline" to "lspline" for a less oscillating curve, but I guess that there is no benefit in using spline interpolation.
Remark: You talked about "polynomial fit" and even though I called my function (wrongly) "fit" it is NOT a fit but rather an interpolation, no matter if linear or spline. A polynomial fit could be obtained using polyfit, but the resulting curve normally would not run through a single single one of the 15 given data points (unless you chose a polynomial of order 14) but will be a good overall fit. Here an example to fit the data with a simple quadratic parabola:
One additional remark: Luckily the x values were the same for both data sets (vx=vx65). If the data would have been sampled at different x values, an additional step would have been necessary.
Modified P6 worksheet attached
- Mark as New
- Bookmark
- Subscribe
- Mute
- Subscribe to RSS Feed
- Permalink
- Notify Moderator
Hello Werner,
That is really great and exactly what I was looking for. I also worked this in Excel and did the linear interpolation between the two points individually to generate a new curve, but was not sure how to do this in MathCAD.
Thanks very much for your help!
- Mark as New
- Bookmark
- Subscribe
- Mute
- Subscribe to RSS Feed
- Permalink
- Notify Moderator
Hello Werner,
The solution is really great, but I realized the T23 and T65 are temperatures and the T65 is really -65°C so the separation is 23°C - (-65°C) = 88°C. I think that will throw the interpolation off a bit. I was unable to change this successfully in the spreadsheet using a negative value. Do you have any suggestions on how this can be done?
Thanks in advance.
- Mark as New
- Bookmark
- Subscribe
- Mute
- Subscribe to RSS Feed
- Permalink
- Notify Moderator
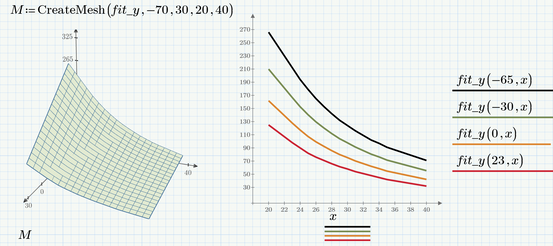
All that should be necessary is to change the definition of "T" and "yData".
Because Primes interpolation expects the values in ascending order, the order in both vectors must be exchanged.
Of course you would also change the values used in the plots
- Mark as New
- Bookmark
- Subscribe
- Mute
- Subscribe to RSS Feed
- Permalink
- Notify Moderator
Ah, that makes sense. I did not realize I needed to change the order from lowest to highest. Thank you very much!


