
Turn on suggestions
Auto-suggest helps you quickly narrow down your search results by suggesting possible matches as you type.
Showing results for
Turn on suggestions
Auto-suggest helps you quickly narrow down your search results by suggesting possible matches as you type.
Showing results for
Community Tip - Stay updated on what is happening on the PTC Community by subscribing to PTC Community Announcements. X
Options
- Subscribe to RSS Feed
- Mark Topic as New
- Mark Topic as Read
- Float this Topic for Current User
- Bookmark
- Subscribe
- Mute
- Printer Friendly Page
Forced Oscillation Testing
Aug 20, 2013
10:31 AM
- Mark as New
- Bookmark
- Subscribe
- Mute
- Subscribe to RSS Feed
- Permalink
- Notify Moderator
Aug 20, 2013
10:31 AM
Forced Oscillation Testing
Hi,
Not sure if this is the best place to put this thread, or in the mechanical/civil engineering section. It's in the civil secn as well but noticed that there wasn't much activity there, If you could let me know I can change it if it's better suited elsewhere, thanks.
Anyway, I'm having a bit of a problem regarding some experiments I carried out. It involved forced oscillation testing of a midwater arch, which is used in oil fields. The arch was oscillated at various amplitudes and frequencies in order to determine the 2 coefficients of the Morison eqn:
F = 1/2 p Cd Xd [Xd] + Cm p V Xdd (p = rho , Xd = velocity, Xdd = accn, Cd and Cm the constants which I need)
I have created a worksheet that will analyse the data and give results for Cd and Cm. The problem is that the results I am getting are not what I expect. Cd is very small, and Cm is very large. I am not sure if this is something I have overlooked in Mathcad, or is a theoretical error. I was told that you guys might be able to help, which is why I'm posting.
If you can offer any suggestions, or see any glaring errors, it would be very much appreciated.
Data 1-3 refers to the axial direction at 0.2, 0.3 and 0.5Hz. Data 4-6 the transverse at the same freqs. Data 10-12 is the files for the experimental set up which has to be subtracted from the overall force to give the force on the model alone.
There is a data 7-9 but I haven't uploaded as file size too large. The only input in the sheet required is to choose a file at the top in the drop down box, and then choose a corresponding file in the Processing for Sting region.
Labels:
- Labels:
-
Mechanical_Engineering
19 REPLIES 19
Aug 20, 2013
11:46 AM
- Mark as New
- Bookmark
- Subscribe
- Mute
- Subscribe to RSS Feed
- Permalink
- Notify Moderator
Aug 20, 2013
11:46 AM
Your file is very big which is probably why most people have not bothered to download it. It's best to try to produce a smaller simplified version if possible.
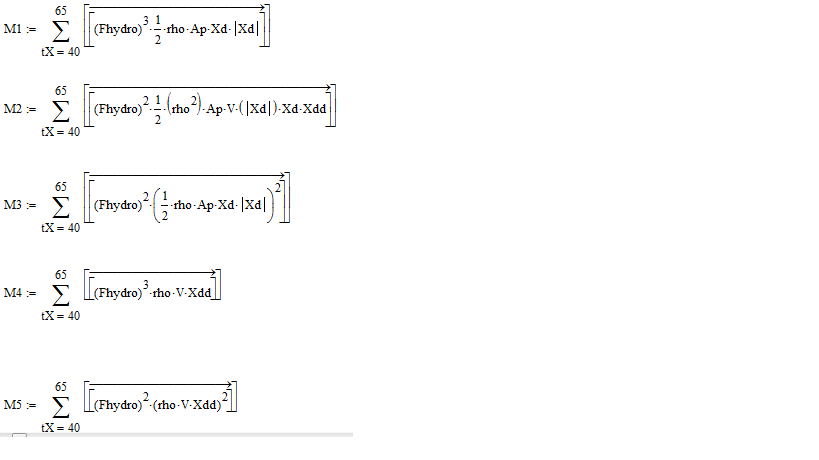
With regard to your calculations of M1, M2 etc. note:
1. When you take the absolute value of a vector you get a single scalar, not a vector of absolute values.
2. When you multiply two vectors of the same size together in Mathcad you get a single scalar.
3. Why do you raise Fhydro to the power 0, which just gets you a vector of ones?
4. Your summations seem to want to use values of tX from 50 to 70, but nothing inside the summation depends on tX. If you simply multiply what's inside the summation by 21 you get the same results. (Also note that some of the vectors, such as Xd, have zeros in positions 50 to 70).
Can't help any further at this stage as there isn't enough explanation within the file as to what is going on. You probably know the meaning of all your calculations, but I'm afraid I don't!
Alan
Aug 20, 2013
11:58 AM
- Mark as New
- Bookmark
- Subscribe
- Mute
- Subscribe to RSS Feed
- Permalink
- Notify Moderator
Aug 20, 2013
11:58 AM
Hi Alan thanks a lot for your response.
1) You're right. It's a vector of absolute values that I need. What would be the syntax if known?
2) Again, what would be the syntax to get a vector of multiples for each row if known?
3) The theory is based on the weighted/non-weighted least squares fitting method. Raising to the power 0 reduces the eqn to what it was originally, raising to the pure of 2k where k is an integer gives weight to the data which is near the maximal values. Weighted will give a higher estimate, but will also put more emphasis on noise. It would be good to get a weighted result as it would give the coeffficients which best approximate the max values, but atm I am purely focused on getting sensible approximations before I start changing things.
4) I think this is a key point. I want to integrate, or sum, the values within tX, where each row would correlate with the appropriate row in the other vectors involved. For example, Fhydro, Xd, Xdd etc. at tX=50, and so forth....
Sorry if the sheet wasn't very well explained, I'm a somewhat Mathcad rookie. Thanks for your time with this.
Aug 20, 2013
12:07 PM
- Mark as New
- Bookmark
- Subscribe
- Mute
- Subscribe to RSS Feed
- Permalink
- Notify Moderator
Aug 20, 2013
12:07 PM
martin sharkey wrote:
1) You're right. It's a vector of absolute values that I need. What would be the syntax if known?
1. Use the vectorise operator from the Matrix menu:
However, since you are selecting terms from within a summation, all your vectors should have subscript tX, in which case you won't need the vectorise operator.
2) Again, what would be the syntax to get a vector of multiples for each row if known?
Same as above.
4) I think this is a key point. I want to integrate, or sum, the values within tX, where each row would correlate with the appropriate row in the other vectors involved. For example, Fhydro, Xd, Xdd etc. at tX=50, and so forth....
Sorry if the sheet wasn't very well explained, I'm a somewhat Mathcad rookie. Thanks for your time with this.
As mentioned above, each vector within the summation should have subscript tX. However, as I noted in my previous post, some of your vectors contain all zeros in this range, so your M's will evaluate as 0.
For example:
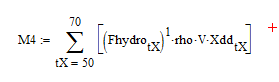
But because Xdd has zeros in positions 50 to 70, M4 will be zero!
Alan
Added picture of summation.
Aug 20, 2013
04:08 PM
- Mark as New
- Bookmark
- Subscribe
- Mute
- Subscribe to RSS Feed
- Permalink
- Notify Moderator
Aug 20, 2013
04:08 PM
Thanks Alan,
I tried the above, but when I tried to use the subscript tX it said this value must be an integer. My sampling points are 0.0073s apart, how could I fix this?
Also, isn't the way I've defined Xd, Xdd etc already between tXmin and tXmax?
Thanks again
Aug 20, 2013
04:51 PM
- Mark as New
- Bookmark
- Subscribe
- Mute
- Subscribe to RSS Feed
- Permalink
- Notify Moderator
Aug 20, 2013
04:51 PM
OK so sorted the above, but still having an issue with point 2 you made. Should I multiply the vectors through as follows:
Does this make sense? It's giving me an answer of 0 for Cm which is wrong, is the error in the above vectors or elsewhere?
Aug 20, 2013
05:19 PM
- Mark as New
- Bookmark
- Subscribe
- Mute
- Subscribe to RSS Feed
- Permalink
- Notify Moderator
Aug 20, 2013
05:19 PM
Just had a quick look over the file and noticed, that
1) the drop down box at the top does not work as you fix the file to 1/1084 later (in the yellow region
2) if I fix this and chose a different file the last section will throw errors because the vectors have different length.
I guess the limits in your sums will also be different according to the sheet chosen - are the the t1 t2 values you pick from the matrices Ri?
That you get Cm=0 - isn't that what Alan mentioned as Xdd will consist of zeros?
Aug 20, 2013
05:48 PM
- Mark as New
- Bookmark
- Subscribe
- Mute
- Subscribe to RSS Feed
- Permalink
- Notify Moderator
Aug 20, 2013
05:48 PM
Hi Werner,
The drop down box can be fixed, for now I'm just inputting the file into the (Series File) yellow box.
You're exactly right, t1 and t2 are called from the matrix Ri. It would probably help if I clarified what the goal of this sheet is.
- To read the data from the data files r1-r12.
- Zero all the signals so that everything is oscillating about 0, or close to.
- Select a range of steady oscillations (t1 and t2).
- Subtract the force of the experimental set up from the measured force on the model + set up, so that we are left with the force on the model only. I also subtract the mass of model multiplied by the acceleration to remove the newtonian inertia effect.
- From the signal remaining, calculate Cd and Cm from the equations given (M1 etc.....). This is basically a method of simultaneously extracting the 2 coefficients, whilst seperating the effect due to drag and due to inertia. I want to sum the given eqns over the range of steady oscillations, t1 and t2, and then use these in the eqns for M1 - M5, which should give values for Cd and Cm.
The 2 areas which I think the error may be coming - where I find velocity and acceleration from the amplitude graph. I have tried to get velocity, acceleration and amplitude on a constant time axis (tX) so that I can directly multiply, subtract etc. If I were not to do this, then the 3 values would be in the same phase when called later.
Or, in the way in which I am using the vectors, as highlighted by Alan above. The syntax I'm using to multiply the vectors and sum over the range may be completely wrong. I checked Xd and Xdd, not sure where the 0s are, I can't seem to find a region of 0s in the array.
Thanks
Aug 20, 2013
07:48 PM
- Mark as New
- Bookmark
- Subscribe
- Mute
- Subscribe to RSS Feed
- Permalink
- Notify Moderator
Aug 20, 2013
07:48 PM
I still won't be able to wade through your file as I am missing expertise on my side and more comments in the file on yours. Whenever I try I loose track. So I didn't check how you manipulated your signals but concentrated on the sums at the end of the "unfiltered" section (in the "Sine fitted" section you would have to work on the problem with the different dimensions of vectors first, I think).
You didn't spot the zeros Alan was talking about? Look at the vector Xdd for example - the first 344 elements are zero, so all elements from number 40 to nr 65 are zero. But as you didnt saw the zeros I think you have a problem with the understanding of the sum. What did you think that the expression
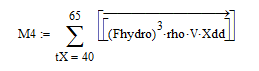
would do? I guess you thought that it will look up your vector tX and sums up the expression for all values in the involved vectors which correspond to elements in your vector tX which are in the range from 40 to 65.
But thats not true. The expression above will run an integer variable tX (which has nothing to do with your vector tX) from 40 to 65 in steps of 1 and calculate the expression and adds it to the sum. In the example above the same result would be calculated 26 times and it would use the full vectors Fhydro, Xdd, etc. Sure not what you had in mind.
See in the attached file a solution to this - are the values Cd and Cm more reasonable now? Hope I understood correctly what you intended with the sum, but I am concerned as of the fact that the highest value in your vector tX is about 45, so why would you try to sum up to tX=65 or even 70 in your sheet???
Aug 20, 2013
08:36 PM
- Mark as New
- Bookmark
- Subscribe
- Mute
- Subscribe to RSS Feed
- Permalink
- Notify Moderator
Aug 20, 2013
08:36 PM
Werner,
That's exactly what I thought my first approach would do lol, clearly not!
You're approach looks far better. I was working on one, I think it might be similar to that approach?
I called it array2 as I had used array earlier as a trial, but the rows are the same so N still applies. Not sure how this differs from yours but value slightly different. I will have a look at this tomorrow and report back, but the value for Cd which yours gives is near enough perfect.
Thanks for everything
Aug 20, 2013
09:02 PM
- Mark as New
- Bookmark
- Subscribe
- Mute
- Subscribe to RSS Feed
- Permalink
- Notify Moderator
Aug 20, 2013
09:02 PM
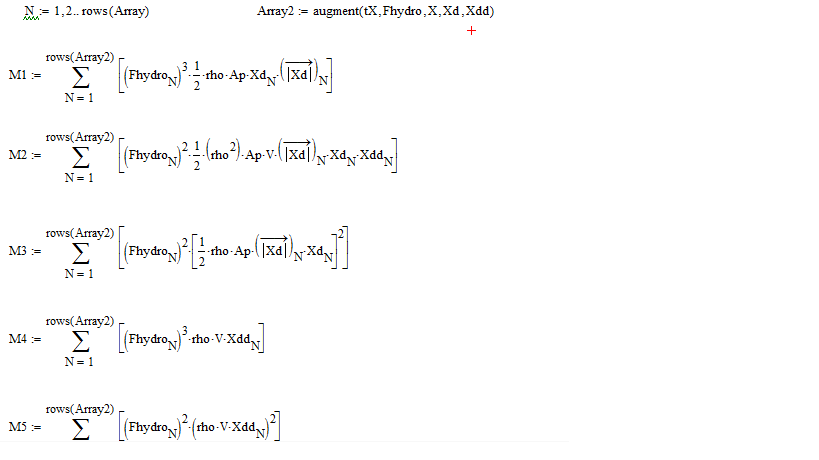
I don't see any reason for the construction of the "Array2", at least not for anything I see in this screenshot. Maybe you need that array later, but I doubt it.
Augment simply puts the vectors side by side so you get a matrix with exactly the number of rows the vectors have and in your case five columns. cause you augment five single column vectors.
There is no reason you should define the range variable N. Its created automatically implicitely by the sum symbol. So if you don't need them later you can delete the range N and the matrix Array2. Simply replace rows(Array2) by rows(tX) (or better: spend a variable for the number of rows rather than calculating it five times), which should be the same, if you like the calculation using the whole vectors.
The difference to the version I posted is that you use the full vectors while mine uses just those elements, where the corresponding tX values are in the range you had specified (for whatever reason). So I am summing up less elements and thats the reason for any differences in the results.
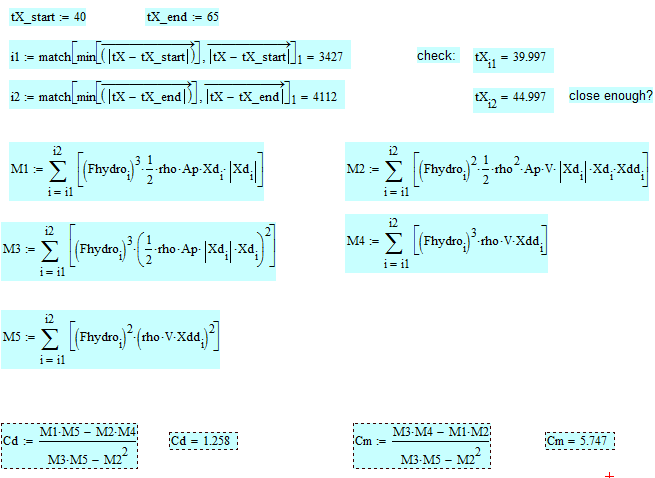
In the example I am using the elelements from index 3427 (tX=39.997) up to the last index 4112 (tX=44.997, the last value, even if you would accept t-values up to 65), that is 686 elements, while you use alle 4112 elements in your calculation.
If I set i1:=1 in my sheet I get Cd=-1.11 and Cm=5.451 which should be the results you get with your formulas.
The two expressions using match calculate the indices i1 and i2 of the values in tX which are closest to tX_start and tX_end you had specified.
In the data set you selected originally tX_end (65) is larger than the biggest value in tX, so we have to be happy with 45 instead of 65.
Aug 21, 2013
06:57 AM
- Mark as New
- Bookmark
- Subscribe
- Mute
- Subscribe to RSS Feed
- Permalink
- Notify Moderator
Aug 21, 2013
06:57 AM
Still getting a bit of trouble, are you able to check if my method of shifting the velocity, accn and amplitude graphs on to a constant time axis is OK?
Thanks
Aug 21, 2013
07:12 AM
- Mark as New
- Bookmark
- Subscribe
- Mute
- Subscribe to RSS Feed
- Permalink
- Notify Moderator
Aug 21, 2013
07:12 AM
OK in what respect? Which data/variables should be shifted to achieve what effect?
Where in your sheet do I find those calculations?
Aug 21, 2013
07:19 AM
- Mark as New
- Bookmark
- Subscribe
- Mute
- Subscribe to RSS Feed
- Permalink
- Notify Moderator
Aug 21, 2013
07:19 AM
I have to obtain velocity and accn from the amplitude graph. I'm doing so by shifting the data 1/4 cycle and 1/2 cycle respectively, but I must have a time vector which is consistent with X (amplitude), Xd (velocity) and Xdd (accn), so that when I come to carry out my summing later on, the Xd values correlate with the appropriate Xdd values etc As Xd, Xdd and X are on 1 time axis, I have to reference data which is 1/2 cycle and 1/4 cycle away, if you understand what I mean?
It can be found in hydrodynamic coefficients - unfiltered.
Thanks
Aug 21, 2013
09:46 AM
- Mark as New
- Bookmark
- Subscribe
- Mute
- Subscribe to RSS Feed
- Permalink
- Notify Moderator
Aug 21, 2013
09:46 AM
I think its the part which was that much far to the right which I moved over to the left in the sheet I posted, right?
I understand that you have a tabled function and want to derive the first and second derivative of it. As you know the function is a sine and you additionally know the frequency, you try to do it by simply shifting the data and multiply it by omega each time. Its tricky and very special to this signal but it should work.
But I don't know why you think it may be wrong.
And especially I get lost in your files as of the many different variables used for (sometimes) the same thing.
tX seems to be same as tAFs<1> in the calculations above. What about X? Its derived from Asf (its simply Asf renamed). It looks on first sight that it should be the same as tAFs<2>, but no! Looking in another section above we see that its not tAFs<2> because variable Filter is set to "no" and so Asf is in reality equal to As. What's As? As is derive from A and A is ...?? what has it to do with tAFs<2>? Sorry, I don't care anymore!! So if you are concerned why the two graphs don't look alike, it may be as of different data used.
So all I can say is that the shifting you did to derive Xd from X seems to be not OK - its shifted in the wrong direction. Xdd is OK as a shift by -T/2 is the same as one by +T/2. You see it at least upon visual inspection of the X,XdXdd over tX graph.The multiplication with omega and omega^2 seems reasonable to me. The minus sign in the calculation for Xdd is obsolete as it gets squared, too, but the minus you get by talking the second derivative of a sine is already compensated anyway by the phase shift by half a period you made.
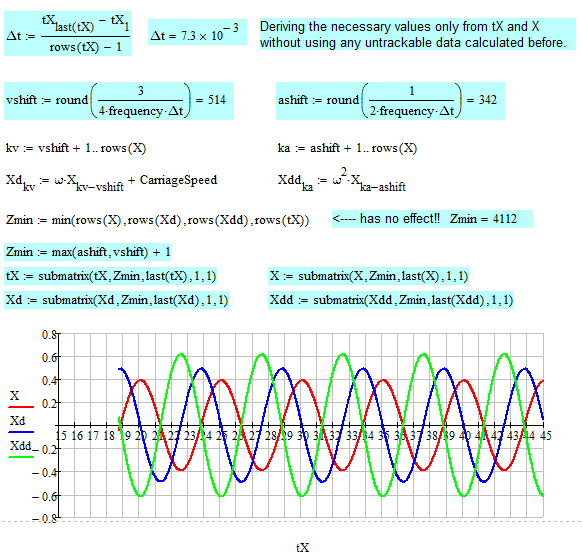
What you see in the graph is, that, because of the shifting action, the vectors Xd and Xdd will contain invalid data (zeros) at the beginning, so it may be a good idea to cut off half a period from the beginning of all four vectors (tX,X,Xd,Xdd).
Another approach to get the derivatives would be to find the sine-function fitting the data best (as we did for the phase shift question) and use Mathcads analytic derivative. But if you shift in the right direction (which is to the left!) or for 3period/4 instead of period/4 it should work the way you did it, too.
One last thought about the shifting between distance and force vectors (As and Fs) we did in the prior thread. You demanded in your question that you want the maximal force at the time when the distance As (you called it amplitude, I think) is zero. I guess that may not be enough as what you demand would mean that one of the signals is either a quarter of a period in front OR below the other. I suppose that it does matter which of the two and that it should only be one of them.
Aug 21, 2013
10:45 AM
- Mark as New
- Bookmark
- Subscribe
- Mute
- Subscribe to RSS Feed
- Permalink
- Notify Moderator
Aug 21, 2013
10:45 AM
Here is a correction of the wrong shift of Xd. The method you had chosen would work with some modification in the other direction, too, but it would be more hassle later when trying to trim all four vectors to the same lenghth keeping the dependency. So I shifted the X-sine 3/4 of the period to the right to get the derivative. You must keep in mind that adding a positive number to the time means a shift of the graph to the left, not to the right!
Aug 21, 2013
06:15 PM
- Mark as New
- Bookmark
- Subscribe
- Mute
- Subscribe to RSS Feed
- Permalink
- Notify Moderator
Aug 21, 2013
06:15 PM
Werner,
Not sure about your shift, it makes everything out of phase which should be in phase. I think I've sorted it. The filter code wasn't working as I redefined fs as 1/trange when it should have been 1/deltat. Cm coming out much more reasonable than before, Cd not so much but think (hope) it is to do with the experiments being so inertia dominated that the data isn't so great for obtaining a drag coefficient.
There's an issue with the sine fit, seems to be fitting the negative of the filtered data. Attached the sheet, if you get a chance then have a look but don't want you wasting too much of your time on this, you've already done enough!
Very greatful for your help.
Aug 21, 2013
06:36 PM
- Mark as New
- Bookmark
- Subscribe
- Mute
- Subscribe to RSS Feed
- Permalink
- Notify Moderator
Aug 21, 2013
06:36 PM
martin sharkey wrote:
Werner,
Not sure about your shift, it makes everything out of phase which should be in phase. I think I've
Not sure what you mean. I was concentrating on tX, X, Xd and Xdd alone and that seemed OK. Of course I noticed that the subsequent calculations (fhydro and the matrices for the calc of cm and cd) failed, but you used so many different data vectors there I didn't bother to follow them and replace them for tX, X etc. to keeo things consistent. But you seemed to have sorted that out.
Acoording the sine fit - you still think its OK and necessary to do that change in the measured data?
Why don't you use the last posted version (the one with the FFT to get the guesses and Richard zero padding) - there are also some errors in the phase shift corrected.
In the sheet you you posted you try a fit for Fsf. Why do you compare it with fhydro? Is it the same?
Aug 21, 2013
06:58 PM
- Mark as New
- Bookmark
- Subscribe
- Mute
- Subscribe to RSS Feed
- Permalink
- Notify Moderator
Aug 21, 2013
06:58 PM
Excellent, thanks.
I literally just came across a paper which clarifies my train of thought above, that Cd is not extractable for tests in which KC < 7. I tested from KC = 1 - 4.5 Cannot tell you how much of a relief that is.
Thanks for all your time and patience Werner, much obliged
Aug 21, 2013
07:37 PM
- Mark as New
- Bookmark
- Subscribe
- Mute
- Subscribe to RSS Feed
- Permalink
- Notify Moderator
Aug 21, 2013
07:37 PM
Excellent, thanks.
? Not sure what you mean.
I literally just came across a paper which clarifies my train of thought above, that Cd is not extractable for tests in which KC < 7. I tested from KC = 1 - 4.5 Cannot tell you how much of a relief that is.
Glad to hear.
Anyway here is the sheet with additions which might help. Ot does the above mean that the sine shift would not be necessary at all?

