
Turn on suggestions
Auto-suggest helps you quickly narrow down your search results by suggesting possible matches as you type.
Showing results for
Turn on suggestions
Auto-suggest helps you quickly narrow down your search results by suggesting possible matches as you type.
Showing results for
Community Tip - You can subscribe to a forum, label or individual post and receive email notifications when someone posts a new topic or reply. Learn more! X
Options
- Subscribe to RSS Feed
- Mark Topic as New
- Mark Topic as Read
- Float this Topic for Current User
- Bookmark
- Subscribe
- Mute
- Printer Friendly Page
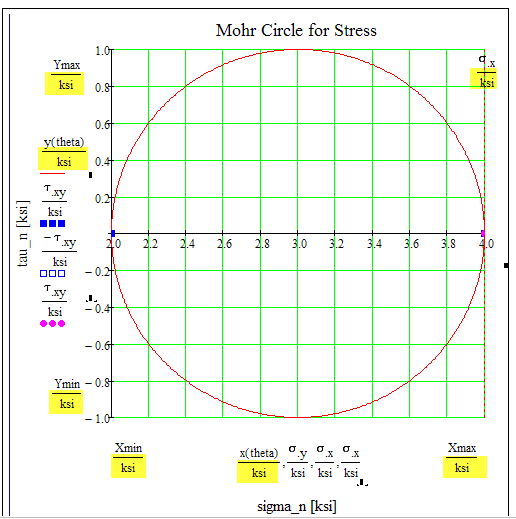
Graph x,y values
Nov 20, 2014
11:10 AM
- Mark as New
- Bookmark
- Subscribe
- Mute
- Subscribe to RSS Feed
- Permalink
- Notify Moderator
Nov 20, 2014
11:10 AM
Graph x,y values
Hello,
i am not sure why the x and y values are so large in the graph. Thanks!
Solved! Go to Solution.
Labels:
- Labels:
-
Other
1 ACCEPTED SOLUTION
Accepted Solutions
Nov 20, 2014
11:35 AM
- Mark as New
- Bookmark
- Subscribe
- Mute
- Subscribe to RSS Feed
- Permalink
- Notify Moderator
Nov 20, 2014
11:35 AM
The values you see semm to be in SU unit Pascal. Even though you have chose U.S. system this seems to be the unit system chosen by the plot region if not otherwise told. Generally the values in a plot should better be unitless, so divide ALL by the unit you want, not just a few.
3 REPLIES 3
Nov 20, 2014
11:35 AM
- Mark as New
- Bookmark
- Subscribe
- Mute
- Subscribe to RSS Feed
- Permalink
- Notify Moderator
Nov 20, 2014
11:35 AM
The values you see semm to be in SU unit Pascal. Even though you have chose U.S. system this seems to be the unit system chosen by the plot region if not otherwise told. Generally the values in a plot should better be unitless, so divide ALL by the unit you want, not just a few.
Nov 20, 2014
11:50 AM
- Mark as New
- Bookmark
- Subscribe
- Mute
- Subscribe to RSS Feed
- Permalink
- Notify Moderator
Nov 20, 2014
11:50 AM
Thank you Werner!
where do i change the unit for the plot if i want to?i never knew the plot has a seperate unit.
Nov 20, 2014
11:55 AM
- Mark as New
- Bookmark
- Subscribe
- Mute
- Subscribe to RSS Feed
- Permalink
- Notify Moderator
Nov 20, 2014
11:55 AM
sameer fares wrote:
Thank you Werner!
where do i change the unit for the plot if i want to?i never knew the plot has a seperate unit.
I am not sure but I guess thats hard coded. Just make sure that all axis arguments are unitless by dividing them by the desired display unit. So get back control.

