
Turn on suggestions
Auto-suggest helps you quickly narrow down your search results by suggesting possible matches as you type.
Showing results for
Turn on suggestions
Auto-suggest helps you quickly narrow down your search results by suggesting possible matches as you type.
Showing results for
Community Tip - Learn all about the Community Ranking System, a fun gamification element of the PTC Community. X
Options
- Subscribe to RSS Feed
- Mark Topic as New
- Mark Topic as Read
- Float this Topic for Current User
- Bookmark
- Subscribe
- Mute
- Printer Friendly Page
Graphing if statements
Oct 15, 2014
04:03 PM
- Mark as New
- Bookmark
- Subscribe
- Mute
- Subscribe to RSS Feed
- Permalink
- Notify Moderator
Oct 15, 2014
04:03 PM
Graphing if statements
Hello,
Another problem I'm having is with graphing if statements. I tried the milti-line one a I wouldn't graph and I couldn't get the single line if(test,true,false) to work. I have tried both with and with out units. The if statement doesn't like the variable with a range. I tried to do vectro selection, the [ , but that didn't work either. I'm sorry if this is a stupid question with an easy solution, I think it is.
Thanks,
Solved! Go to Solution.
Labels:
- Labels:
-
Other
1 ACCEPTED SOLUTION
Accepted Solutions
Oct 15, 2014
04:12 PM
- Mark as New
- Bookmark
- Subscribe
- Mute
- Subscribe to RSS Feed
- Permalink
- Notify Moderator
5 REPLIES 5
Oct 15, 2014
04:12 PM
- Mark as New
- Bookmark
- Subscribe
- Mute
- Subscribe to RSS Feed
- Permalink
- Notify Moderator
Oct 15, 2014
08:57 PM
- Mark as New
- Bookmark
- Subscribe
- Mute
- Subscribe to RSS Feed
- Permalink
- Notify Moderator
Oct 15, 2014
08:57 PM
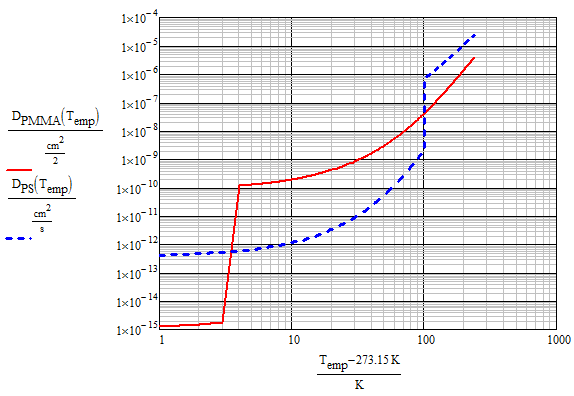
Thanks, I knew it was something simple like that. It is close but if I don't use units I need to convert C to K which is why the graph looks weird.
Oct 15, 2014
09:58 PM
- Mark as New
- Bookmark
- Subscribe
- Mute
- Subscribe to RSS Feed
- Permalink
- Notify Moderator
Oct 15, 2014
09:58 PM
Kendall Cotton wrote:
Thanks, I knew it was something simple like that. It is close but if I don't use units I need to convert C to K which is why the graph looks weird.
??
Maybe a log-log scale would be more appropriate?
Oct 16, 2014
02:35 AM
- Mark as New
- Bookmark
- Subscribe
- Mute
- Subscribe to RSS Feed
- Permalink
- Notify Moderator
Oct 16, 2014
02:35 AM
Kendall Cotton wrote:
Thanks, I knew it was something simple like that. It is close but if I don't use units I need to convert C to K which is why the graph looks weird.
I do not understand. The method I posted works with units.
Oct 15, 2014
04:16 PM
- Mark as New
- Bookmark
- Subscribe
- Mute
- Subscribe to RSS Feed
- Permalink
- Notify Moderator
Oct 15, 2014
04:16 PM
When defining the two functions you want to plot you have to type T.emp for the argument - you forgot to subscript the "emp".
Another way to fix it is to remove all those subscripts from the right side of the definition.

