
Turn on suggestions
Auto-suggest helps you quickly narrow down your search results by suggesting possible matches as you type.
Showing results for
Turn on suggestions
Auto-suggest helps you quickly narrow down your search results by suggesting possible matches as you type.
Showing results for
Community Tip - Did you get an answer that solved your problem? Please mark it as an Accepted Solution so others with the same problem can find the answer easily. X
Options
- Subscribe to RSS Feed
- Mark Topic as New
- Mark Topic as Read
- Float this Topic for Current User
- Bookmark
- Subscribe
- Mute
- Printer Friendly Page
Graphing the same function on Primary and Secondary Y axis with different Units.
Jun 04, 2012
11:56 AM
- Mark as New
- Bookmark
- Subscribe
- Mute
- Subscribe to RSS Feed
- Permalink
- Notify Moderator
Jun 04, 2012
11:56 AM
Graphing the same function on Primary and Secondary Y axis with different Units.
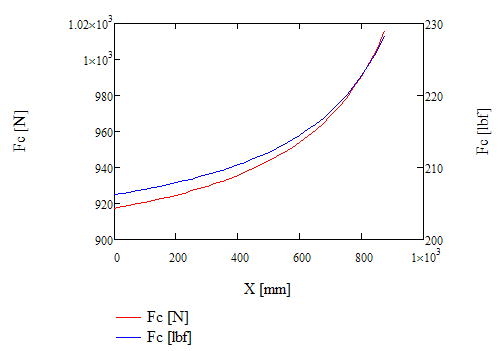
I'm trying to create a graph of a force vs distance graph in MathCad 14 and would like to show the output of the function in both Newtons and Lbf. I have set up the plot with the primary and secondary axis both plotting the same function but returning results using different units. The scaling of the second axis does not match up directly with the primary axis and as such the funtion plots are not co-linear which is visually confusing. Is there a way to have the dual Y axis for different units without plotting the function twice? Or link the scales so that the graphs are the same? In the photo below I would like only one graph but associated with both the primary and secondary axis, with the secondary axis scaled to match the primary.
3 REPLIES 3
Jun 04, 2012
12:21 PM
- Mark as New
- Bookmark
- Subscribe
- Mute
- Subscribe to RSS Feed
- Permalink
- Notify Moderator
Jun 04, 2012
12:21 PM
You have the ability to set the end points of your scales; you can force the scales to be the same, but divisions of one scale are going to be strange numbers.
Jun 05, 2012
03:52 AM
- Mark as New
- Bookmark
- Subscribe
- Mute
- Subscribe to RSS Feed
- Permalink
- Notify Moderator
Jun 04, 2012
03:12 PM
- Mark as New
- Bookmark
- Subscribe
- Mute
- Subscribe to RSS Feed
- Permalink
- Notify Moderator
Jun 04, 2012
03:12 PM
One example - The balance of the fluid (cubic meters Primary axis Y and barrels- Secondary Y) in a cylindrical tsistserne with spherical bottoms.


