
Turn on suggestions
Auto-suggest helps you quickly narrow down your search results by suggesting possible matches as you type.
Showing results for
Turn on suggestions
Auto-suggest helps you quickly narrow down your search results by suggesting possible matches as you type.
Showing results for
Community Tip - You can subscribe to a forum, label or individual post and receive email notifications when someone posts a new topic or reply. Learn more! X
Options
- Subscribe to RSS Feed
- Mark Topic as New
- Mark Topic as Read
- Float this Topic for Current User
- Bookmark
- Subscribe
- Mute
- Printer Friendly Page
[HELP] XY Plot from Matrix
Nov 01, 2015
05:19 AM
- Mark as New
- Bookmark
- Subscribe
- Mute
- Subscribe to RSS Feed
- Permalink
- Notify Moderator
Nov 01, 2015
05:19 AM
[HELP] XY Plot from Matrix
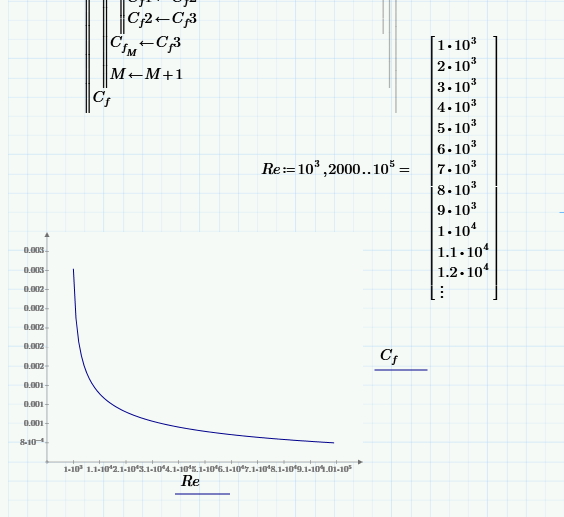
hi, i wanted to plot Cf versus Re curve from the output of the function, but it not works.
Please help. Thanks.
Labels:
- Labels:
-
Other
2 REPLIES 2
Nov 02, 2015
10:39 AM
- Mark as New
- Bookmark
- Subscribe
- Mute
- Subscribe to RSS Feed
- Permalink
- Notify Moderator
Nov 02, 2015
10:39 AM
Unfortunately I can only read files in 3.0 format but not in 3.1 - PTC has decides that even every subversion should have its own file format and being incompatibel with older versions . crazy.
So unless you provide a screenshot or a pdf printout of your file, I am unable to see what you are trying to do.
Usually it should work without problems to plot one vector over another one, given they have the same dimension and given that they really are vectors.
If you feed your function with a range variable, neither that variable nor the function output are vectors. Maybe thats the problem.
If thats the case, try to turn Re into a vector and create Cf by feeding that vector into your function - possibly you have to vectorize that function call.
WE
Nov 02, 2015
10:42 AM
- Mark as New
- Bookmark
- Subscribe
- Mute
- Subscribe to RSS Feed
- Permalink
- Notify Moderator
Nov 02, 2015
10:42 AM
Kenneth Chaw wrote:
hi, i wanted to plot Cf versus Re curve from the output of the function, but it not works.
Please help. Thanks.
Cf is a vector, but Re is a range variable. You need to make Re into a vector, so just type '=' after the expression. This makes Prime iterate over the range variable and return a vector.
Stuart

