
Turn on suggestions
Auto-suggest helps you quickly narrow down your search results by suggesting possible matches as you type.
Showing results for
Turn on suggestions
Auto-suggest helps you quickly narrow down your search results by suggesting possible matches as you type.
Showing results for
Community Tip - Your Friends List is a way to easily have access to the community members that you interact with the most! X
Options
- Subscribe to RSS Feed
- Mark Topic as New
- Mark Topic as Read
- Float this Topic for Current User
- Bookmark
- Subscribe
- Mute
- Printer Friendly Page
How can I find the intersection points on the graph ?????
Nov 13, 2011
09:36 AM
- Mark as New
- Bookmark
- Subscribe
- Mute
- Subscribe to RSS Feed
- Permalink
- Notify Moderator
Nov 13, 2011
09:36 AM
How can I find the intersection points on the graph ?????
I'm from ukraine, and sorry for my english. I need help in this graph.
i have 5 functions in graph.
i need to find the intersection points on the graph.
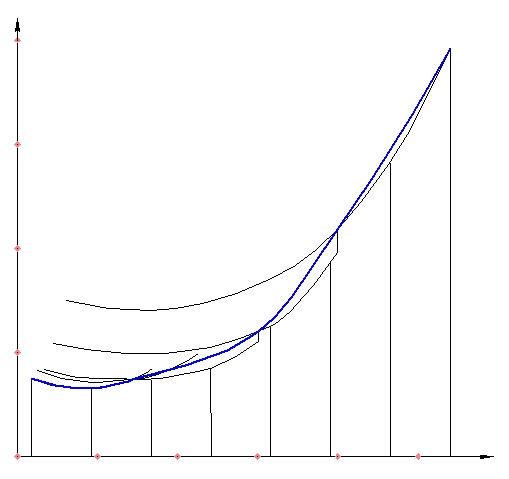
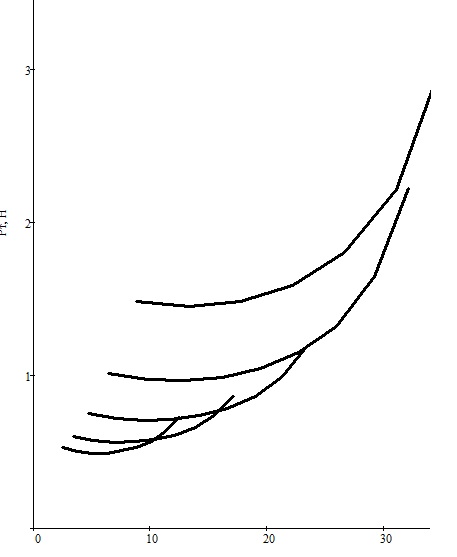 From 1st graph i need to do second graph.
So maybe someone can help me.
Solved! Go to Solution.
1 ACCEPTED SOLUTION
Accepted Solutions
Nov 13, 2011
11:49 AM
- Mark as New
- Bookmark
- Subscribe
- Mute
- Subscribe to RSS Feed
- Permalink
- Notify Moderator
Nov 13, 2011
11:49 AM
you can set up a solve block to find the values where the plots cross. Attached is an example for one pair of graphs
26 REPLIES 26
Nov 13, 2011
11:49 AM
- Mark as New
- Bookmark
- Subscribe
- Mute
- Subscribe to RSS Feed
- Permalink
- Notify Moderator
Nov 13, 2011
11:49 AM
you can set up a solve block to find the values where the plots cross. Attached is an example for one pair of graphs
Nov 14, 2011
05:01 AM
- Mark as New
- Bookmark
- Subscribe
- Mute
- Subscribe to RSS Feed
- Permalink
- Notify Moderator
Nov 14, 2011
05:01 AM
Tell me please How do I interpolate and make a new spline function
Nov 13, 2011
02:03 PM
- Mark as New
- Bookmark
- Subscribe
- Mute
- Subscribe to RSS Feed
- Permalink
- Notify Moderator
Nov 13, 2011
02:03 PM
Please tell me where is my error. What I'm doing wrong. I dont understand.
Nov 13, 2011
02:39 PM
- Mark as New
- Bookmark
- Subscribe
- Mute
- Subscribe to RSS Feed
- Permalink
- Notify Moderator
Nov 13, 2011
05:00 PM
- Mark as New
- Bookmark
- Subscribe
- Mute
- Subscribe to RSS Feed
- Permalink
- Notify Moderator
Nov 13, 2011
05:00 PM
Hi,
With MP1, I am unable to get the intersection point as an output, however, there is a line function you can use to get the point of intersection.
you will need one for x-axis, and another one for y-axis.
Hope this is helpful.
Nov 14, 2011
05:02 AM
- Mark as New
- Bookmark
- Subscribe
- Mute
- Subscribe to RSS Feed
- Permalink
- Notify Moderator
Nov 14, 2011
05:02 AM
Tell me please How do I interpolate and make a new spline function
Nov 14, 2011
10:10 AM
- Mark as New
- Bookmark
- Subscribe
- Mute
- Subscribe to RSS Feed
- Permalink
- Notify Moderator
Nov 14, 2011
10:10 AM
Your sheet is behaving strangely. In the definition for zk series, change the end (x[m) to x[5.
For some reason (on your sheet on my computer m = 2.
Add one more series to your plot: on the abcissa add z, on the ordinate add Y(z).
Works for me!
Nov 14, 2011
12:34 PM
- Mark as New
- Bookmark
- Subscribe
- Mute
- Subscribe to RSS Feed
- Permalink
- Notify Moderator
Nov 14, 2011
12:34 PM
Maybe something like this.
but this is not the kind of graphics that I've sought.
I want to look like the graph I have indicated above the figure.
is it possible to do?
Nov 14, 2011
01:04 PM
- Mark as New
- Bookmark
- Subscribe
- Mute
- Subscribe to RSS Feed
- Permalink
- Notify Moderator
Nov 14, 2011
01:04 PM
You can fit a curve to the intersection points, the attached file fits a second order polynomial through the first three intersection points (look up "regress."
Please note that I took a long time to figure out the different styles for the same variable name. THIS WAS VERY CONFUSING AND FRUSTRATING.
Nov 14, 2011
02:40 PM
- Mark as New
- Bookmark
- Subscribe
- Mute
- Subscribe to RSS Feed
- Permalink
- Notify Moderator
Nov 14, 2011
02:40 PM
From all that you wroteI understand a little bit.
I do not know much English and I use a translator.
But I want to know. Is it possible to construct a second graph that I showed in the first message.
I need to connect and use the spline curves and split it into several parts. Then calculate the area using the integral (with scale).
Nov 14, 2011
04:13 PM
- Mark as New
- Bookmark
- Subscribe
- Mute
- Subscribe to RSS Feed
- Permalink
- Notify Moderator
Nov 14, 2011
03:13 PM
- Mark as New
- Bookmark
- Subscribe
- Mute
- Subscribe to RSS Feed
- Permalink
- Notify Moderator
Nov 14, 2011
03:13 PM
Fred,
You are a saint.
Nov 14, 2011
04:06 PM
- Mark as New
- Bookmark
- Subscribe
- Mute
- Subscribe to RSS Feed
- Permalink
- Notify Moderator
Nov 14, 2011
04:06 PM
To throw my two pence worth in - I was going to try and offer a solution, but I immediately get put off when I see a worksheet laid out like the attached. It's all over the place and very hard to follow.
Mike
Nov 15, 2011
12:44 PM
- Mark as New
- Bookmark
- Subscribe
- Mute
- Subscribe to RSS Feed
- Permalink
- Notify Moderator
Nov 15, 2011
12:44 PM
Thank you very much for your help.
And here's is my result.
My question is: how to extend the spline curve 4 to 5 in your chart.
Nov 15, 2011
02:08 PM
- Mark as New
- Bookmark
- Subscribe
- Mute
- Subscribe to RSS Feed
- Permalink
- Notify Moderator
Nov 15, 2011
02:08 PM
I've looked at your sheet.
I've tried to decipher what you're doing.
You have many different styles, with the same variable names, so I cannot easily track what your logic flow is
Your worksheet is up to 5 pages wide, there are several places where many empty pages are between work. This makes following you sheet difficuult.
You have several places where you define the same function differently (particularly J_5) and it's not clear to me which one you're using or if it's a redefinition.
The function J_5 that you're plotting appears (to me) to be returning an array of nine values for each value you pass it; I don't know why (or how) it's plotting.
If you clean up this sheet so that I can understand it;
- rename variables rather than change styles so that there is no redundancy of names,
- eliminate extra space in the sheet so I don't have to hunt for the next piece
Then I will be happy to try to help.
This is too much aggravation. Sorry.
Nov 15, 2011
03:49 PM
- Mark as New
- Bookmark
- Subscribe
- Mute
- Subscribe to RSS Feed
- Permalink
- Notify Moderator
Nov 15, 2011
03:49 PM
- rename variables rather than change styles so that there is no redundancy of names DONE
- eliminate extra space in the sheet so I don't have to hunt for the next piece DONE
Now maybe can try to do something with this graph? Its realy important for me!I shall be grateful if you help me!
Nov 15, 2011
04:15 PM
- Mark as New
- Bookmark
- Subscribe
- Mute
- Subscribe to RSS Feed
- Permalink
- Notify Moderator
Nov 15, 2011
04:15 PM
Viktor,
I have to agree with Fred. The worksheet is horribly laid out and hard to follow. I cannot imagine that worksheet ever being turned into a working document.
Mike
Nov 15, 2011
04:21 PM
- Mark as New
- Bookmark
- Subscribe
- Mute
- Subscribe to RSS Feed
- Permalink
- Notify Moderator
Nov 15, 2011
04:21 PM
Why is the last point of J_5(n.i[8) not correct? The math can be checked.
Nov 16, 2011
05:10 AM
- Mark as New
- Bookmark
- Subscribe
- Mute
- Subscribe to RSS Feed
- Permalink
- Notify Moderator
Nov 16, 2011
05:10 AM
Because after the point J_5(n.i[7) of calculation and construction are not needed.
Nov 16, 2011
09:15 AM
- Mark as New
- Bookmark
- Subscribe
- Mute
- Subscribe to RSS Feed
- Permalink
- Notify Moderator
Nov 16, 2011
11:47 AM
- Mark as New
- Bookmark
- Subscribe
- Mute
- Subscribe to RSS Feed
- Permalink
- Notify Moderator
Nov 16, 2011
11:47 AM
I dont understand what you mean in this sheet.
Nov 16, 2011
01:27 PM
- Mark as New
- Bookmark
- Subscribe
- Mute
- Subscribe to RSS Feed
- Permalink
- Notify Moderator
Nov 16, 2011
01:27 PM
Viktor Gantsevskiy wrote:
I dont understand what you mean in this sheet.
I changed the way you sheet works. I re-did the function definitions so they weren't plotting vectors but functions, and all the J_ functions plot against the same parameter. That makes finding intersection points and bounding functions easier.
I've added explainations to the sheet.
And tried to explain what I believe about functions.
Nov 16, 2011
02:21 PM
- Mark as New
- Bookmark
- Subscribe
- Mute
- Subscribe to RSS Feed
- Permalink
- Notify Moderator
Nov 16, 2011
02:21 PM
Fred, what you did - it's a miracle. Thank you very much for your help. Thanks for everything.
Nov 16, 2011
02:46 PM
- Mark as New
- Bookmark
- Subscribe
- Mute
- Subscribe to RSS Feed
- Permalink
- Notify Moderator
Nov 16, 2011
02:46 PM
Happy to help!
Sorry it took so many iterations.
😉
Nov 17, 2011
04:32 AM
- Mark as New
- Bookmark
- Subscribe
- Mute
- Subscribe to RSS Feed
- Permalink
- Notify Moderator
Nov 17, 2011
04:32 AM
I'm so happy for your help! thaks!
Nov 17, 2011
04:35 AM
- Mark as New
- Bookmark
- Subscribe
- Mute
- Subscribe to RSS Feed
- Permalink
- Notify Moderator
Nov 17, 2011
04:35 AM
I'm so happy for your help! thaks!

