
Turn on suggestions
Auto-suggest helps you quickly narrow down your search results by suggesting possible matches as you type.
Showing results for
Turn on suggestions
Auto-suggest helps you quickly narrow down your search results by suggesting possible matches as you type.
Showing results for
Community Tip - You can change your system assigned username to something more personal in your community settings. X
Options
- Subscribe to RSS Feed
- Mark Topic as New
- Mark Topic as Read
- Float this Topic for Current User
- Bookmark
- Subscribe
- Mute
- Printer Friendly Page
How to plot a 3D vector as an array: attempts and problems
Dec 18, 2014
04:07 PM
- Mark as New
- Bookmark
- Subscribe
- Mute
- Subscribe to RSS Feed
- Permalink
- Notify Moderator
Dec 18, 2014
04:07 PM
How to plot a 3D vector as an array: attempts and problems
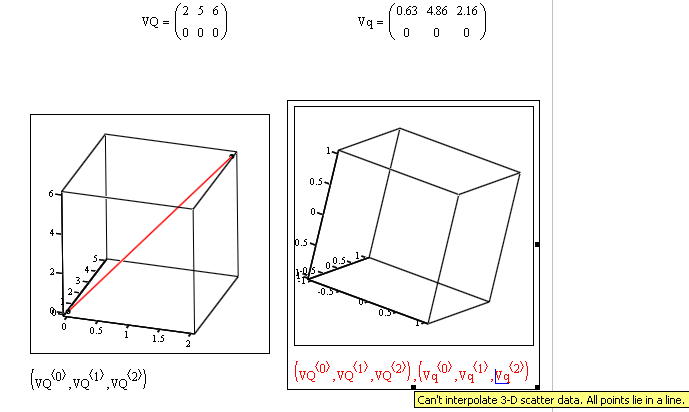
I am using MC v.11.2, and I attempted to plot a column vector (3x1), as one would do in Vector algebra.
I saw in the forum for help, and I found the following method:
1. Take the vector and turn it in the first row of a matrix of dimension 2x3
2. Place in the second row of the matrix the coordinates of the origin of the vector (in my case zero)
3. Create a 3D Scatter (or Field) Plot and write the three columns of the above matrix.
I tried in MC 15, and it works for more than one vector. I re-tried several times the same with v.11.2 and the following error is shown (see figure).
I timidly ask:
a) Is it possible to plot more than one vector in MC v.11.2 with the above method?
b) If it is possibile with the method above, where is my error and how many vectors can one plot (I would need at least 3 or 4).
c) If it is impossible, are there some other effective methods able to do it with MC v11.2?
Thanks for any feedback.
BTW, this is one field where MC lies behind as compare to competitors, where there is a specific command to plot vectors without any additional trouble.
Solved! Go to Solution.
Labels:
- Labels:
-
Algebra_Geometry
1 ACCEPTED SOLUTION
Accepted Solutions
Dec 18, 2014
05:29 PM
- Mark as New
- Bookmark
- Subscribe
- Mute
- Subscribe to RSS Feed
- Permalink
- Notify Moderator
Dec 18, 2014
05:29 PM
I tried in MC 15, and it works for more than one vector. I re-tried several times the same with v.11.2 and the following error is shown (see figure).
I get the very same error in Mathcad 15. The reason is that unless you change that a 3D plot defaults to a surface plot. If you set the plot type to "Data Points" / "Scatter Plot" for BOTH plots, it works OK. There is an age old bug in the 3D plot component so simply chosing scatter/data points does not help. You have to change the plot type to vector field first and then to scatter.
I am not sure about MC 11 but it works that way in MC15.
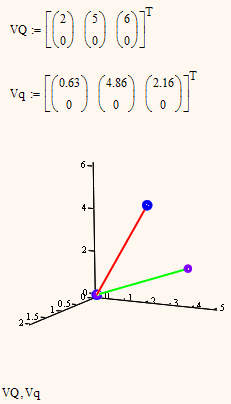
Instead of typing the various column selectors in the plot placeholder you may as well plot a data type like the following:
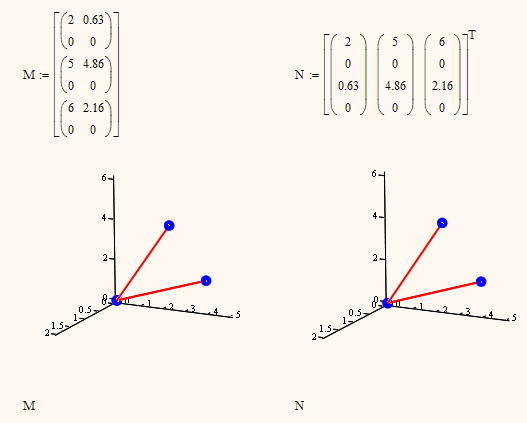
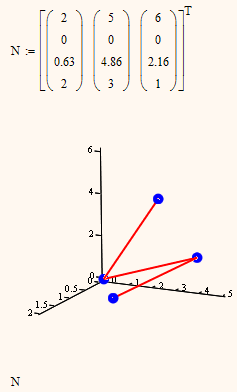
You may also plot one of the following matrices which creates just one single plot and not multiple ones, but it looks better than is is. Mathcad will connect ALL four points which just isn't seen in this example because oth vectors include the origin. So the cennection of the last point of the first with the first point of the second vector happens to be the second vector itself and this second vector is draw twice that way. Change the zero coordinates of the second vector and you will see.
In a 2D plot we would thrown in NaN's to stop Mathcad from connecting points, but unfortunately the 3D plot component in Mathcad 15 and below does not support NaNs and will throw an error.
I add the MC15 file saved in MC11 format - maybe its of help.
10 REPLIES 10
Dec 18, 2014
05:29 PM
- Mark as New
- Bookmark
- Subscribe
- Mute
- Subscribe to RSS Feed
- Permalink
- Notify Moderator
Dec 18, 2014
05:29 PM
I tried in MC 15, and it works for more than one vector. I re-tried several times the same with v.11.2 and the following error is shown (see figure).
I get the very same error in Mathcad 15. The reason is that unless you change that a 3D plot defaults to a surface plot. If you set the plot type to "Data Points" / "Scatter Plot" for BOTH plots, it works OK. There is an age old bug in the 3D plot component so simply chosing scatter/data points does not help. You have to change the plot type to vector field first and then to scatter.
I am not sure about MC 11 but it works that way in MC15.
Instead of typing the various column selectors in the plot placeholder you may as well plot a data type like the following:
You may also plot one of the following matrices which creates just one single plot and not multiple ones, but it looks better than is is. Mathcad will connect ALL four points which just isn't seen in this example because oth vectors include the origin. So the cennection of the last point of the first with the first point of the second vector happens to be the second vector itself and this second vector is draw twice that way. Change the zero coordinates of the second vector and you will see.
In a 2D plot we would thrown in NaN's to stop Mathcad from connecting points, but unfortunately the 3D plot component in Mathcad 15 and below does not support NaNs and will throw an error.
I add the MC15 file saved in MC11 format - maybe its of help.
Dec 18, 2014
07:27 PM
- Mark as New
- Bookmark
- Subscribe
- Mute
- Subscribe to RSS Feed
- Permalink
- Notify Moderator
Dec 18, 2014
07:27 PM
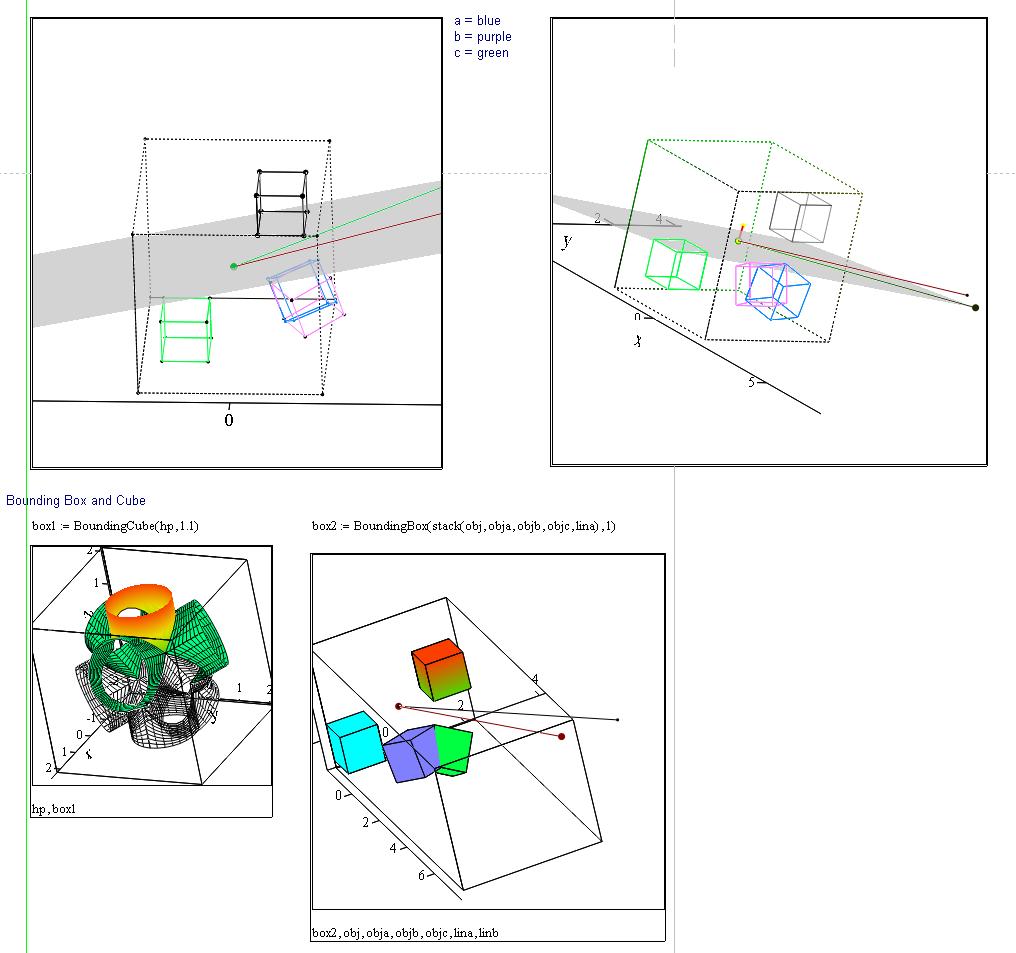
If you want a really OTT worksheet showing how to plot vectors in 3D plots, here's something Stuart cooked up a while ago 
Dec 19, 2014
12:22 AM
- Mark as New
- Bookmark
- Subscribe
- Mute
- Subscribe to RSS Feed
- Permalink
- Notify Moderator
Dec 19, 2014
12:22 AM
Dear Richard,
thanks to you too. The attached file shows very interesting plots, that I never thought were possible. Yet to understand how all that works, need a bit (more) of time, given my limited knowledge in MC. I guess the Stuart's file gives a lot more than just turning column 1x3 vectors into a cartesian 3D plot. But as an example it is challenging and interesting.
Dec 19, 2014
12:32 AM
- Mark as New
- Bookmark
- Subscribe
- Mute
- Subscribe to RSS Feed
- Permalink
- Notify Moderator
Dec 19, 2014
12:32 AM
Yet to understand how all that works, need a bit (more) of time
I've had the worksheet for years, and have not had time to figure out everything about how it works. Like I said, an OTT example
Dec 19, 2014
10:32 AM
- Mark as New
- Bookmark
- Subscribe
- Mute
- Subscribe to RSS Feed
- Permalink
- Notify Moderator
Dec 19, 2014
10:32 AM
Richard Jackson wrote:
Yet to understand how all that works, need a bit (more) of time
I've had the worksheet for years, and have not had time to figure out everything about how it works. Like I said, an OTT example
Nah, that's not OTT. This is OTT ...
Stuart
Dec 19, 2014
09:21 AM
- Mark as New
- Bookmark
- Subscribe
- Mute
- Subscribe to RSS Feed
- Permalink
- Notify Moderator
Dec 19, 2014
09:21 AM
On the theme of "If you liked that, you'll like this", here's a (somewhat messy) worksheet that introduces functions to replace or augment Mathcad's built-in matrix, CreateSpace and CreateMesh functions. They make it easier (for me, at least) to evaluate functions, and plot functions in 3D, and get the correct x and y axis values.
Expand the Utilities Area to see their definitions - it's not neat because it's a development (ie, "making stuff up as I go along") worksheet.
Stuart
Message was edited by: Stuart Bruff worksheet replaced to correct type in function 'Vector'.
Dec 19, 2014
01:06 PM
- Mark as New
- Bookmark
- Subscribe
- Mute
- Subscribe to RSS Feed
- Permalink
- Notify Moderator
Dec 19, 2014
01:06 PM
Thanks Stuart.
Not easy to learn on the fly but interesing as a challenge of what can be done. Great work and congratulations to your expertize.
Dec 19, 2014
07:17 AM
- Mark as New
- Bookmark
- Subscribe
- Mute
- Subscribe to RSS Feed
- Permalink
- Notify Moderator
Dec 19, 2014
07:17 AM
Richard Jackson wrote:
If you want a really OTT worksheet showing how to plot vectors in 3D plots, here's something Stuart cooked up a while ago
Thats indeed a very special sheet! 
Whats the limit for the number of different plots in a 3D plot?
Dec 19, 2014
08:54 AM
- Mark as New
- Bookmark
- Subscribe
- Mute
- Subscribe to RSS Feed
- Permalink
- Notify Moderator
Dec 19, 2014
08:54 AM
Werner Exinger wrote:
Whats the limit for the number of different plots in a 3D plot?
It's at least several thousand - see the worksheet attached to Valery's "Draw a Dolphin" thread - http://communities.ptc.com/message/258838#258838 . I've loaded a couple of large .ply files with it.
I couldn't have done the colouring without using the scripted version of the 3D Plot component, though.
Stuart
Dec 19, 2014
12:15 AM
- Mark as New
- Bookmark
- Subscribe
- Mute
- Subscribe to RSS Feed
- Permalink
- Notify Moderator
Dec 19, 2014
12:15 AM
Dear WE,
many thanks for your help. I shall confront your attached file with mine a little more, to understand how it works.
But let me say that you are absolutely right in stating - contrary to what I wrote in my first post - that it is not enough in MC 15 to insert the two vectors. One needs, as you say, to turn at some point the plot to "scatter plot". The example that inspired me was from: http://communities.ptc.com/docs/DOC-2488#comment-6098
and probably the plot in that example was already "cured" against the bug as you suggested.
Tweaking the plot in that way makes also v.11.2 working (in v.11.2 Scatter plot is called Data plot)!

