
Turn on suggestions
Auto-suggest helps you quickly narrow down your search results by suggesting possible matches as you type.
Showing results for
Turn on suggestions
Auto-suggest helps you quickly narrow down your search results by suggesting possible matches as you type.
Showing results for
Community Tip - New to the community? Learn how to post a question and get help from PTC and industry experts! X
Options
- Subscribe to RSS Feed
- Mark Topic as New
- Mark Topic as Read
- Float this Topic for Current User
- Bookmark
- Subscribe
- Mute
- Printer Friendly Page
How to plot a two-dimentional matrix?
Feb 03, 2014
08:49 PM
- Mark as New
- Bookmark
- Subscribe
- Mute
- Subscribe to RSS Feed
- Permalink
- Notify Moderator
Feb 03, 2014
08:49 PM
How to plot a two-dimentional matrix?
In Mathcad we can easely plot a two-dimentional function z=Z(x,y)
Is there a way, to plot a two-dimentional matrix z=Mj,j ?
Thank you!
Labels:
- Labels:
-
Other
8 REPLIES 8
Feb 03, 2014
10:16 PM
- Mark as New
- Bookmark
- Subscribe
- Mute
- Subscribe to RSS Feed
- Permalink
- Notify Moderator
Feb 03, 2014
10:16 PM
Is there a way, to plot a two-dimentional matrix z=Mj,j ?
Sure, if you are happy with the indices i and j to be taken as x and y values you can plot M the same as f via quickplot (= simply put M in the placeholder of the 3D-plot).
If not you would need the vectors of associated x and y values and would have to create a data structure of nested matrices like createmesh() produces.
Feb 04, 2014
04:25 PM
- Mark as New
- Bookmark
- Subscribe
- Mute
- Subscribe to RSS Feed
- Permalink
- Notify Moderator
Feb 04, 2014
04:25 PM
Thank you very much!
Feb 03, 2014
10:38 PM
- Mark as New
- Bookmark
- Subscribe
- Mute
- Subscribe to RSS Feed
- Permalink
- Notify Moderator
Feb 03, 2014
10:38 PM
One way to do it: M[i, j -> f(x, y) -> Surface
or Mathcad Prime
and the plot
Feb 04, 2014
04:26 PM
- Mark as New
- Bookmark
- Subscribe
- Mute
- Subscribe to RSS Feed
- Permalink
- Notify Moderator
Feb 04, 2014
04:26 PM
Thank you very much, Valery!
Feb 03, 2014
11:45 PM
- Mark as New
- Bookmark
- Subscribe
- Mute
- Subscribe to RSS Feed
- Permalink
- Notify Moderator
Feb 03, 2014
11:45 PM
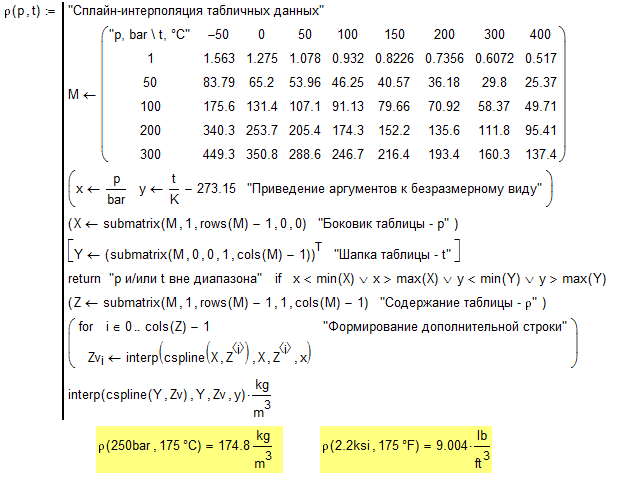
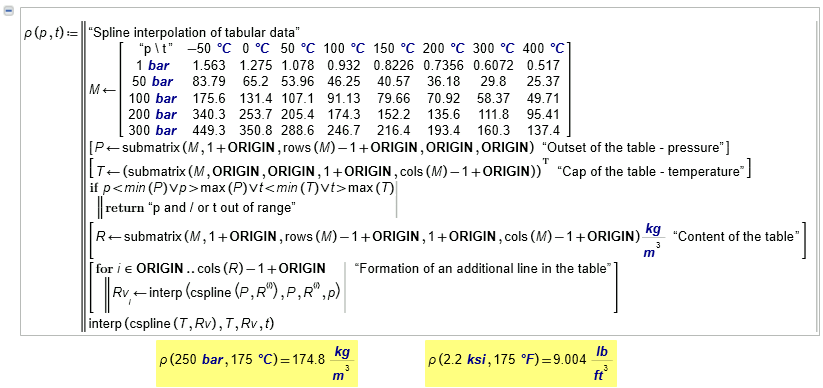
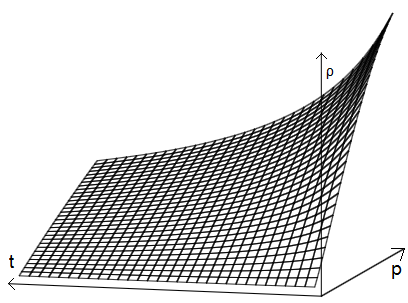
Find attached some ways to plot data matrices:
1) Quickplot
2) nested data arrays
3) turning the matrix into a function using
a) linear interpolation, or
b) cubic spline interpolation
Hope you find soemthing which fits your needs.
Feb 04, 2014
04:27 PM
- Mark as New
- Bookmark
- Subscribe
- Mute
- Subscribe to RSS Feed
- Permalink
- Notify Moderator
Feb 04, 2014
04:27 PM
Thank you very much!
Feb 04, 2014
04:37 PM
- Mark as New
- Bookmark
- Subscribe
- Mute
- Subscribe to RSS Feed
- Permalink
- Notify Moderator
Feb 04, 2014
04:37 PM
You are welcome.
So you found, what you were searching for?
Feb 04, 2014
05:50 PM
- Mark as New
- Bookmark
- Subscribe
- Mute
- Subscribe to RSS Feed
- Permalink
- Notify Moderator
Feb 04, 2014
05:50 PM
Yes, it was very informative and helpful!

