
Turn on suggestions
Auto-suggest helps you quickly narrow down your search results by suggesting possible matches as you type.
Showing results for
Turn on suggestions
Auto-suggest helps you quickly narrow down your search results by suggesting possible matches as you type.
Showing results for
Community Tip - If community subscription notifications are filling up your inbox you can set up a daily digest and get all your notifications in a single email. X
Options
- Subscribe to RSS Feed
- Mark Topic as New
- Mark Topic as Read
- Float this Topic for Current User
- Bookmark
- Subscribe
- Mute
- Printer Friendly Page
How to solve this ODE
May 30, 2016
03:26 AM
- Mark as New
- Bookmark
- Subscribe
- Mute
- Subscribe to RSS Feed
- Permalink
- Notify Moderator
May 30, 2016
03:26 AM
How to solve this ODE
Hi Experts,
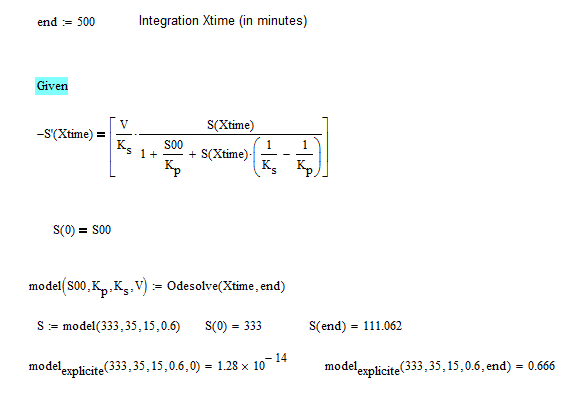
I have here an ODE which I can solve in Mathematica explicite. The Solution is in the green box. But how can I solve this ODE in MathCAD 15?
Solved! Go to Solution.
1 ACCEPTED SOLUTION
Accepted Solutions
May 30, 2016
10:10 AM
- Mark as New
- Bookmark
- Subscribe
- Mute
- Subscribe to RSS Feed
- Permalink
- Notify Moderator
May 30, 2016
10:10 AM
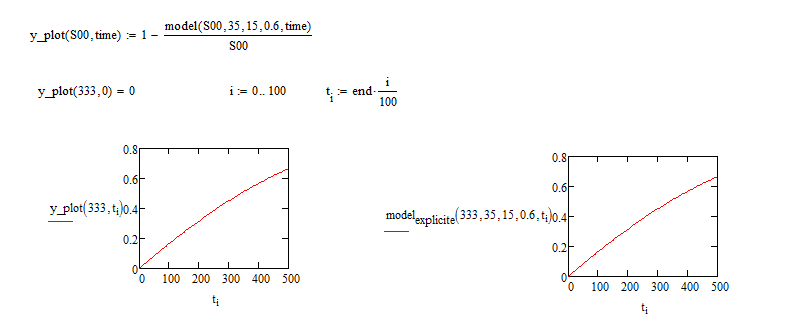
Ok; it took me a while to understand everything, but the attached now has the numerical solution giving (almost) identical results to the symbolic!
I've streamlined the syntax in places.
Alan
30 REPLIES 30
May 30, 2016
04:20 AM
- Mark as New
- Bookmark
- Subscribe
- Mute
- Subscribe to RSS Feed
- Permalink
- Notify Moderator
May 30, 2016
04:20 AM
Unlike Mathematica (and Maple), Mathcad does not have a built-in facility to solve differential equations symbolically. It only has functions to solve ODE's and PDE's numerically using e.g. odesolve() and pdesolve() respectively.
I have a sheet that will allow to solve a linear ODE, but it only works in Mathcad 11. See here: A classical math problem: differential equations
Your ODE is far from linear. Your only option is to solve it by hand and have Mathcad support you wherever possible.
Success!
Luc
May 30, 2016
04:22 AM
- Mark as New
- Bookmark
- Subscribe
- Mute
- Subscribe to RSS Feed
- Permalink
- Notify Moderator
May 30, 2016
04:22 AM
Thanks Luc, I have though so and I am afraid that MathCAD can not solve it - neither symbolically nor numerically.
May 30, 2016
04:41 AM
- Mark as New
- Bookmark
- Subscribe
- Mute
- Subscribe to RSS Feed
- Permalink
- Notify Moderator
May 30, 2016
04:41 AM
WALTER SCHRABMAIR wrote:
Thanks Luc, I have though so and I am afraid that MathCAD can not solve it - neither symbolically nor numerically.
Not so! Although Mathcad can't solve it symbolically. it can solve it numerically - when the Solve block is written correctly - see below.
Also, your explicit model returns 0 (actually, 10^-14) for time 0, even though you pass it an initial value of 333. It seems your symbolic solution is not of the same equations you have written in the solve block.
Incidentally, Mathcad has a built-in symbolic LambertW function (though you need to use the float command to get numerical values from it.
Alan
May 30, 2016
05:06 AM
- Mark as New
- Bookmark
- Subscribe
- Mute
- Subscribe to RSS Feed
- Permalink
- Notify Moderator
May 30, 2016
05:06 AM
Thanks a lot, ok I forgot one equation: Here the y_plot should be the same as the modelexplicite.
But I get an error that there are too many startconditions. How could you solve it on your side?
Thanls
PS: I have MathCAD 15 M040, NO Success with my MC. I tried to put it in a new Worksheet, but no luck.
May 30, 2016
05:41 AM
- Mark as New
- Bookmark
- Subscribe
- Mute
- Subscribe to RSS Feed
- Permalink
- Notify Moderator
May 30, 2016
05:41 AM
You have an unmatched bracket in the solve block (Just to the left of the 1 in the denominator).
Alan
May 30, 2016
06:53 AM
- Mark as New
- Bookmark
- Subscribe
- Mute
- Subscribe to RSS Feed
- Permalink
- Notify Moderator
May 30, 2016
06:53 AM
Thanks a lot, Alan, that works but I can not fit the data. The fitting works with the MMA solution. It is strange, as the numerically solution gives the same results on some t. Would you mind telling me, what is wrong here?
May 30, 2016
10:10 AM
- Mark as New
- Bookmark
- Subscribe
- Mute
- Subscribe to RSS Feed
- Permalink
- Notify Moderator
May 30, 2016
10:10 AM
Ok; it took me a while to understand everything, but the attached now has the numerical solution giving (almost) identical results to the symbolic!
I've streamlined the syntax in places.
Alan
May 30, 2016
11:17 AM
- Mark as New
- Bookmark
- Subscribe
- Mute
- Subscribe to RSS Feed
- Permalink
- Notify Moderator
May 30, 2016
11:17 AM
Dear Alan, thanks a lot!!! I see that the end integration time was not correct. I also see that you calculated the end time by a routine.
Great Done! Thank you very much.
Moreover I would like to calculate the confidence intervalls of the 3 parameter by the Fisher Information Matrix. Unfortunately I got a singularity.
A studid Question: HOw is the conv. intervall calculated by the MMA program ? If it is not going by the Fisher matrix, I would be happy to learn how Mathematica has done it by its build-in packages. Maybe you could give some more advice, I still learn. I really say thanks a lot to you, and maybe it could be of help for others.
May 31, 2016
02:04 AM
- Mark as New
- Bookmark
- Subscribe
- Mute
- Subscribe to RSS Feed
- Permalink
- Notify Moderator
May 31, 2016
02:04 AM
Dear Friends,
in the paper and in the MMA sheet there is the model done with the KRONECKERDELTA Funtkion. This allows that all the 5 euqations can be defined in one. I have tried it to do this in Mathcad the same way. I think it is correct, but the results are a litte differenent. So my question: Is that correct I tried to do? I would be thanksful for any verification. Thanks Moreover I do really not know, why the alternative MInERR Fit is not done with KS and V. I just changed the data, and the Kronecker-Formulea works fine. Can anyone here give me an explaration? In my second try, when I only use the valid data it works fine. Strange! 
May 31, 2016
03:27 AM
- Mark as New
- Bookmark
- Subscribe
- Mute
- Subscribe to RSS Feed
- Permalink
- Notify Moderator
May 31, 2016
03:27 AM
You don't need to use the Kroneker delta function to fit all the data points in one go - see attached.
Alan
May 31, 2016
04:29 AM
- Mark as New
- Bookmark
- Subscribe
- Mute
- Subscribe to RSS Feed
- Permalink
- Notify Moderator
May 31, 2016
04:29 AM
Thank you very much !! I did not know that it can be done without Kronecker. Your solution is much more easilier and sophisticated. Best regards 
May 31, 2016
04:24 AM
- Mark as New
- Bookmark
- Subscribe
- Mute
- Subscribe to RSS Feed
- Permalink
- Notify Moderator
May 31, 2016
04:24 AM
Hi Friends,
now I could calculate the convidence intervalls with the Fischer Informations Matrix. It is nearly the same as the MMA calculates without the FisherMatrix.
But how can I calculate the Confidence intervals (without the FisherMatrix?)
I have read this in the QuickSheets: I thinks this is not correct, what I have done.
May 31, 2016
10:56 AM
- Mark as New
- Bookmark
- Subscribe
- Mute
- Subscribe to RSS Feed
- Permalink
- Notify Moderator
May 31, 2016
10:56 AM
Dear Alan, I tried to get the Confidence intervalls form your sheet, but have no success. Would you mind telling how it could be done, please?
Jun 01, 2016
03:44 AM
- Mark as New
- Bookmark
- Subscribe
- Mute
- Subscribe to RSS Feed
- Permalink
- Notify Moderator
Jun 01, 2016
03:44 AM
HI Friends,
generally the sheet is ready. But one unclear thing still exists:
WHEN I use the differenc-Matrix DerivM with diff:=0.00000001 then I get better results compared with the MMA Sheet as when I make a differenciation (where diff goes to 0). Can anyone give me an advice to this situation? I have added a Question text at the sheet where the position is.
Jun 01, 2016
08:58 AM
- Mark as New
- Bookmark
- Subscribe
- Mute
- Subscribe to RSS Feed
- Permalink
- Notify Moderator
Jun 01, 2016
08:58 AM
WALTER SCHRABMAIR wrote:
... I tried to get the Confidence intervals from your sheet, but have no success....
I think the problem is that, when all the data are run as one, there is no unique value of S0 for a given time. This means the confidence function doesn't know how to interpolate. In effect, the LambertW function is a function of two variables, time and S0, but the confidence function only works with a single variable.
Alan
Jun 01, 2016
10:13 AM
- Mark as New
- Bookmark
- Subscribe
- Mute
- Subscribe to RSS Feed
- Permalink
- Notify Moderator
Jun 01, 2016
10:13 AM
Ok, that is clear. Thanks. But now a more deepter question. If I calculate the standard-err (and then the confidence intervalls) with the Deriv delta Matrix (see my blue marked question in the sheet) it is nearly the same as MMA has. If I put the symb Differentiation and the numer. Differentiation into the sheet then the stderr is bad and does not correlate with the MMA.
MMA can handle the kroneckerdelta function definition and calculates a stderr with its Nonlinearfit package. I know that is a MMA question, but if I make it by hand step by step this rises a question. I have more y values per x value. Which differenciation must be used to get the stderr for the parameters for the whole kroneckerdelta function.
If I have only one curve I can not fit properly. I must use all the data to get Ks, Kp and V. How can I calculate the stderr with MathCAD by hand to get the same results as in MMA?
Thanks a lot for any advices.
Jun 01, 2016
04:30 PM
- Mark as New
- Bookmark
- Subscribe
- Mute
- Subscribe to RSS Feed
- Permalink
- Notify Moderator
Jun 01, 2016
04:30 PM
I've now figured out how to calculate the confidence intervals using the data all in one. See attached.
(I've yet to look at your latest file).
Alan
Jun 01, 2016
04:44 PM
- Mark as New
- Bookmark
- Subscribe
- Mute
- Subscribe to RSS Feed
- Permalink
- Notify Moderator
Jun 01, 2016
04:44 PM
Thank you ver much Alan. In the meantime I found some bug in my sheet. Here is a new and updated one.
I think you have to merge all the Sensitivity Matrixes to on (Rows count = number of all x values) and calculate the Covariances. Then calculate the SSE (either from all x or per curve and sum these up) and from this you get a stderr per curve. Then take the maximum stderr for the parameters. (Orange Result in my sheet)
WHat do you think, could this be ok and correct?
Now I will check your sheet.
Thanks
Jun 01, 2016
04:56 PM
- Mark as New
- Bookmark
- Subscribe
- Mute
- Subscribe to RSS Feed
- Permalink
- Notify Moderator
Jun 01, 2016
04:56 PM
Dear Alan, I get an Exception Error in your sheet. I have MC15 M040 on WIN 7 64bit.
I really would like to run your sheet and learn again. What could I do? Does the sheet work on your side?
Jun 01, 2016
05:30 PM
- Mark as New
- Bookmark
- Subscribe
- Mute
- Subscribe to RSS Feed
- Permalink
- Notify Moderator
Jun 01, 2016
05:30 PM
I could do it by step by step as described in the MathCAD ebook "Quality of Fit"
WIth your idear it works great! THe same results like that from MMA! Great done, thank you very much.
Best Regards
Jun 01, 2016
05:46 PM
- Mark as New
- Bookmark
- Subscribe
- Mute
- Subscribe to RSS Feed
- Permalink
- Notify Moderator
Jun 01, 2016
05:46 PM
After reboot and reformating the sheet works again. Strange. Thanks a lot!
Jun 02, 2016
02:17 AM
- Mark as New
- Bookmark
- Subscribe
- Mute
- Subscribe to RSS Feed
- Permalink
- Notify Moderator
Jun 02, 2016
02:17 AM
Dear Friends, here I have expressed out what I just need still to know. Is my idea to get the proper solution not correct? TO use the max stderr of all stderr of the 5 curves - or - to use the stderr calculated with Sum(SSE per curve) to get the stderr of all x. I would be very thankful for any good advices. 
Jun 02, 2016
04:07 AM
- Mark as New
- Bookmark
- Subscribe
- Mute
- Subscribe to RSS Feed
- Permalink
- Notify Moderator
Jun 02, 2016
04:07 AM
WALTER SCHRABMAIR wrote:
Dear Friends, here I have expressed out what I just need still to know. Is my idea to get the proper solution not correct? TO use the max stderr of all stderr of the 5 curves - or - to use the stderr calculated with Sum(SSE per curve) to get the stderr of all x. I would be very thankful for any good advices.
I'm not sure I fully understand your calculations here. You seem to have generated more degrees of freedom than there are data points! (DF.unadj is 35, but you only have 31 data points)
Also, the definition of chi-squared is unusual. You have it as the sum of the squared residuals (I know this is how it is defined in the Quality of Fit e-book), but, more conventionally, it is defined as the sum[(squared residuals)/(expected values)] or sum[ (observed - expected)^2/expected ].
Alan
Jun 02, 2016
04:17 AM
- Mark as New
- Bookmark
- Subscribe
- Mute
- Subscribe to RSS Feed
- Permalink
- Notify Moderator
Jun 02, 2016
04:17 AM
In my DFA,DFB,DBC there are 4 0 lines. could this the bug?
I have corrected this, by correcting the DFA,DFB,DFC routines and removed the 0 lines.
Jun 02, 2016
04:49 AM
- Mark as New
- Bookmark
- Subscribe
- Mute
- Subscribe to RSS Feed
- Permalink
- Notify Moderator
Jun 02, 2016
04:49 AM
I'm not sure I fully understand your calculations here.
Alan, my idear behind this sheet is to calculate the partial derivatives matrices of every curve and merge these together and calcualte the Covar and then
- case 1
- MSEall * Covar
- case 2
- MSE(per curve) * Covar
Jun 02, 2016
09:04 AM
- Mark as New
- Bookmark
- Subscribe
- Mute
- Subscribe to RSS Feed
- Permalink
- Notify Moderator
Jun 02, 2016
09:04 AM
Incidentally, this is probably the simplest way to get numerical values for the LambertW function in Mathcad:

Alan
Jun 02, 2016
09:38 AM
- Mark as New
- Bookmark
- Subscribe
- Mute
- Subscribe to RSS Feed
- Permalink
- Notify Moderator
Jun 02, 2016
09:38 AM
Yes Alan, but I already have a approx. of LambertW(a) in my sheet also found here in the forum. But my problem right now is to get the stderr of the systemparametes. Your function-substitution to n is the great and right way I think to reduce the 3 dim variable to one dimension and then fit and calculate the stderr as usual. Moreover I have email Wolfram to get more infos about the NonLin Regressen Pack when in the model there is a 3dim-variable. MMA makes it correct even when the depending variable is more-dimensional. I keep trying.
Thanks a lot and best regards.
Jun 03, 2016
02:38 PM
- Mark as New
- Bookmark
- Subscribe
- Mute
- Subscribe to RSS Feed
- Permalink
- Notify Moderator
Jun 03, 2016
02:38 PM
Dear Experts,
here is a monte Carlo simulation of the Michaelis Menten Function. I would like to calculate the standard errors of the parameters by hand and by confidence function.
I can not find my bug or error why the manual stderr of the parameters are completely wrong.
Can anyone help?
Thanks
Jun 02, 2016
10:40 AM
- Mark as New
- Bookmark
- Subscribe
- Mute
- Subscribe to RSS Feed
- Permalink
- Notify Moderator
Jun 02, 2016
10:40 AM
WALTER SCHRABMAIR wrote:
... TO use the max stderr of all stderr of the 5 curves - or - to use the stderr calculated with Sum(SSE per curve) to get the stderr of all x. I would be very thankful for any good advices.
I'm not sure why you would want to use the maximum standard error for everything unless ( i) most of the data you were now going to use fell into that region, or, (ii) you were doing safety-critical calculations and wanted to ensure a pessimistic bias.
Alan

