
Turn on suggestions
Auto-suggest helps you quickly narrow down your search results by suggesting possible matches as you type.
Showing results for
Turn on suggestions
Auto-suggest helps you quickly narrow down your search results by suggesting possible matches as you type.
Showing results for
Community Tip - When posting, your subject should be specific and summarize your question. Here are some additional tips on asking a great question. X
Options
- Subscribe to RSS Feed
- Mark Topic as New
- Mark Topic as Read
- Float this Topic for Current User
- Bookmark
- Subscribe
- Mute
- Printer Friendly Page
M14 2D Plot bug?
Mar 18, 2014
09:58 AM
- Mark as New
- Bookmark
- Subscribe
- Mute
- Subscribe to RSS Feed
- Permalink
- Notify Moderator
Mar 18, 2014
09:58 AM
M14 2D Plot bug?
Hello,
I am having an issue with 2D plots in mathcad. I am unsure if there is a bug, or I am not understanding something. I am using M14 M020 14.0.2.5.
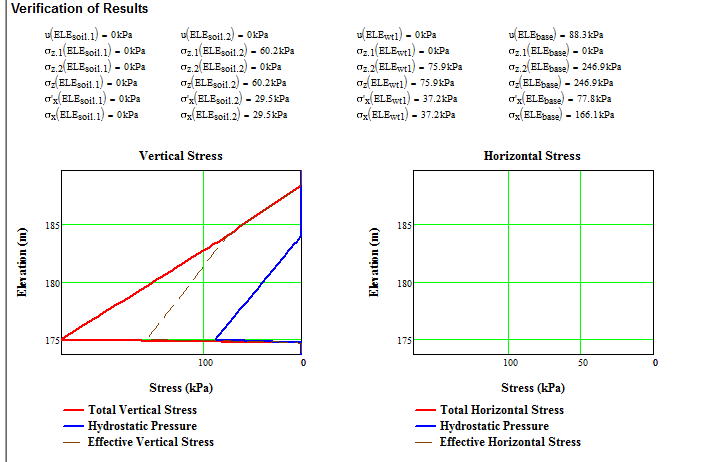
The main issue is that when using certain values for variables, my 2D plots will no longer display. See attached worksheet. With the current values, the plot showing the horizontal stresses is blank, while the vertical stresses are displayed properly. I believe that the values are still being calculated properly.
If the value for zone1 is changed to 1, then the plot displays correctly.
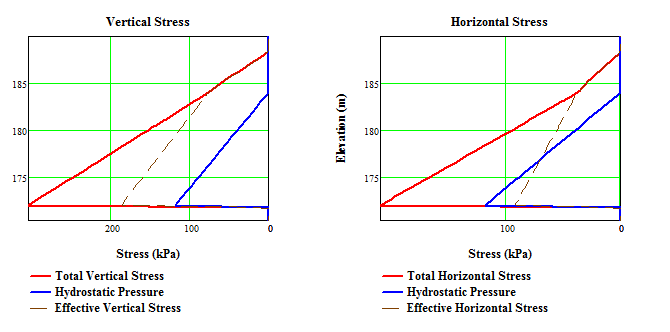
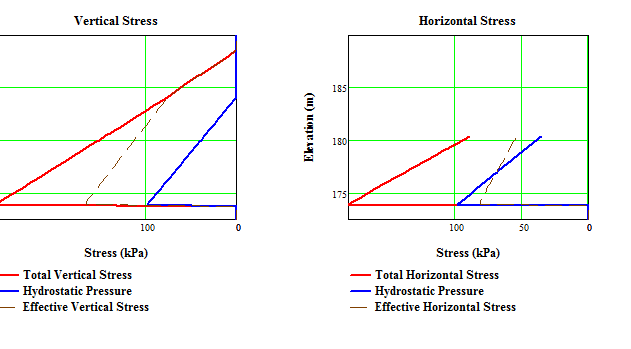
If the value of ELE.base is changed to 170m (with zone1=2)then it displays correctly. If ELE.base is changed to 174, then only part of the plot is displayed.
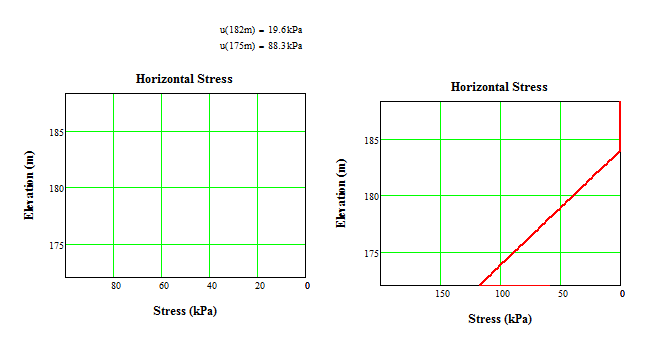
In searching for the cause/solution I have discovered something I don't understand regarding the axis values of the charts. If you look at the plots on the sheet to the right of the main plots, the function plots correctly when the maximum value on the x axis is 200, however when I change it to anything smaller, then the function does not display at all.
This is very strange behaviour which I do not understand. Can anyone explain what is going on?
Solved! Go to Solution.
Labels:
- Labels:
-
Other
1 ACCEPTED SOLUTION
Accepted Solutions
Mar 18, 2014
10:49 AM
- Mark as New
- Bookmark
- Subscribe
- Mute
- Subscribe to RSS Feed
- Permalink
- Notify Moderator
Mar 18, 2014
10:49 AM
Safest to define individual values of y first, then call the sigmas etc. with the individual values, otherwise some of the logic tests get confused. See attached.
Nothing to do with a bug.
Alan
4 REPLIES 4
Mar 18, 2014
10:49 AM
- Mark as New
- Bookmark
- Subscribe
- Mute
- Subscribe to RSS Feed
- Permalink
- Notify Moderator
Mar 18, 2014
10:49 AM
Safest to define individual values of y first, then call the sigmas etc. with the individual values, otherwise some of the logic tests get confused. See attached.
Nothing to do with a bug.
Alan
Mar 18, 2014
12:26 PM
- Mark as New
- Bookmark
- Subscribe
- Mute
- Subscribe to RSS Feed
- Permalink
- Notify Moderator
Mar 18, 2014
12:26 PM
That works great, thanks for the help Alan. Although I'm still not sure I understand why that was happening.
If it is not a bug then am I doing something wrong with my logic tests, or the way I create the functions to be plotted? I'm still in the debugging stage, and so far the results seem to be correct but I haven't run through all possible scenarios yet so I don't know if the actual sigma values are being affected by a mistake in the logic, or if it was just an issue with the plots.
Mar 18, 2014
04:17 PM
- Mark as New
- Bookmark
- Subscribe
- Mute
- Subscribe to RSS Feed
- Permalink
- Notify Moderator
Mar 18, 2014
04:17 PM
If it is not a bug then am I doing something wrong with my logic tests
no
or the way I create the functions to be plotted?
no again.
The reason you encounter those strange effects is because you use Mathcads quickplot feature. Normally to plot a function like sin(x) you write sin(x) at the ordinate and x at the abscissa and x is not defined in the sheet. Mathcad choses a range (-10 to 10 unless you specify other by the limit placeholders), divides that range in 1000 (? not sure about that, at least a fix number) intervals calculates the function values and plots. Mathcads works on the value on the abscissa and this works pretty well as long as the independent variable is placed at the abscissa. switching axis is calling for troubles and thats exactly what you have done. Your independent variable ia´s placed at the vertical ordinate and the dependent function at the abscissa. This tends to make Mathcads quickplot feature fail sometimes.
Way out is to
- plot one precalculated vector of ordinate values over another vector of y-values
- create a vector of y-values and a corresponding rrange variable i, put y[i at the ordinate and on the abscissa evaluate your functions for the individual vector elements y[i. Thats what Alan has suggested.
- make the undefined y a range varible with the desired step width. See attached sheet. I have chosen the values for y.start and y.end from your first plot. I hope its the same range for all the plots (I haven't checked it but the plots look OK for me) otherwise you would have to redefine y befor the plot with different ranges. That way it would not be necesary to specify the end values for y in the plot (thats also true for Alans way).
BTW, its a good idea to use ranges or vector in plots even if the quickplot feature works as it gives you more and more convenient control over the range end values and the precision/number of points to be plotted.
Mar 19, 2014
08:12 AM
- Mark as New
- Bookmark
- Subscribe
- Mute
- Subscribe to RSS Feed
- Permalink
- Notify Moderator
Mar 19, 2014
08:12 AM
Thank you for that clear explanation Werner Exinger! Your post helped me understand the consequences of flipping the x and y axis in the plot. I should have known it wouldn't be as simple as I had hoped!
Kudos to both of you for your knowledge and taking the time to help out a mathcad newbie.

