
Turn on suggestions
Auto-suggest helps you quickly narrow down your search results by suggesting possible matches as you type.
Showing results for
Turn on suggestions
Auto-suggest helps you quickly narrow down your search results by suggesting possible matches as you type.
Showing results for
Community Tip - Did you know you can set a signature that will be added to all your posts? Set it here! X
Options
- Subscribe to RSS Feed
- Mark Topic as New
- Mark Topic as Read
- Float this Topic for Current User
- Bookmark
- Subscribe
- Mute
- Printer Friendly Page
M14; 2D plot for 2 variable function - one variable constant
Apr 03, 2013
01:28 PM
- Mark as New
- Bookmark
- Subscribe
- Mute
- Subscribe to RSS Feed
- Permalink
- Notify Moderator
Apr 03, 2013
01:28 PM
M14; 2D plot for 2 variable function - one variable constant
Hi All,
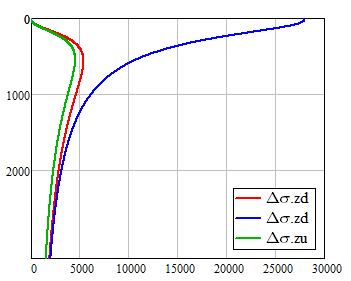
I have a stress equation that is a function of both X and Z (horizontal distance and depth).
I want to produce a 2D plot of this function with a constant X and a variable Z. When I use the 2D plot and input the range variable 'z' on the vertical axis and stress(100,z) it does not give me the correct results.
Any ideas?
Solved! Go to Solution.
1 ACCEPTED SOLUTION
Accepted Solutions
Apr 03, 2013
02:10 PM
- Mark as New
- Bookmark
- Subscribe
- Mute
- Subscribe to RSS Feed
- Permalink
- Notify Moderator
Apr 03, 2013
02:10 PM
z is NOT a range variable in your sheet!
Mathcads quickplot feature would work only for an undefined variable at the abscissa, not the ordinate.
So if you want the independent variable z at the ordinate, you have to define a range variable for z to make it work.
2 REPLIES 2
Apr 03, 2013
02:10 PM
- Mark as New
- Bookmark
- Subscribe
- Mute
- Subscribe to RSS Feed
- Permalink
- Notify Moderator
Apr 03, 2013
02:10 PM
z is NOT a range variable in your sheet!
Mathcads quickplot feature would work only for an undefined variable at the abscissa, not the ordinate.
So if you want the independent variable z at the ordinate, you have to define a range variable for z to make it work.
Apr 03, 2013
02:27 PM
- Mark as New
- Bookmark
- Subscribe
- Mute
- Subscribe to RSS Feed
- Permalink
- Notify Moderator
Apr 03, 2013
02:27 PM
Thanks! I knew it was something simple. Much appreciated.

