
Turn on suggestions
Auto-suggest helps you quickly narrow down your search results by suggesting possible matches as you type.
Showing results for
Turn on suggestions
Auto-suggest helps you quickly narrow down your search results by suggesting possible matches as you type.
Showing results for
Community Tip - Want the oppurtunity to discuss enhancements to PTC products? Join a working group! X
Options
- Subscribe to RSS Feed
- Mark Topic as New
- Mark Topic as Read
- Float this Topic for Current User
- Bookmark
- Subscribe
- Mute
- Printer Friendly Page
MIT 6.003z Signals and Systems
Sep 20, 2012
02:17 PM
- Mark as New
- Bookmark
- Subscribe
- Mute
- Subscribe to RSS Feed
- Permalink
- Notify Moderator
Sep 20, 2012
02:17 PM
MIT 6.003z Signals and Systems
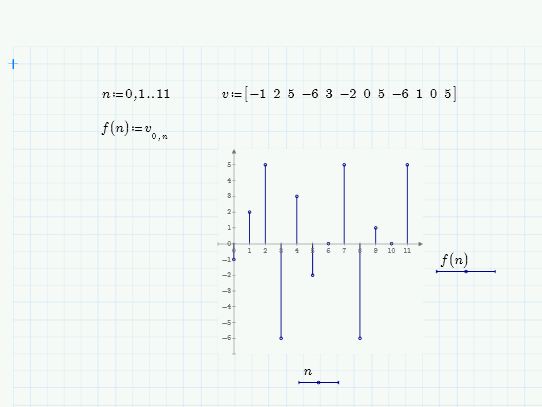
I passed MIT 6.002x and have been following the development of 6,003z "Signals and Systems." Although 6.003z is past Week 10, I'm still at Week 2, trying to figure out how to make Mathcad Prime 2.0 do my homework. The software has a plethora of functions under FUNCTIONS, SIGNAL PROCESSING on the menu bar, but very little help on how these functions can be used. So I'm still working on ways to generate lollipop plots of discrete signals. You can't use the traditional f[n] because brackets have other purposes in Prime 2.0. But that's not a real problem. I use f001(n) to define a number of discrete signals. Is anyone else having fun with lollipop plots (aka stem plots)? Can anyone explain to me how to tell the difference between vectors and arrays which are actually scalars? There must be an easier way than what's shown below.
Labels:
- Labels:
-
Math Homework
2 REPLIES 2
Sep 20, 2012
03:11 PM
- Mark as New
- Bookmark
- Subscribe
- Mute
- Subscribe to RSS Feed
- Permalink
- Notify Moderator
Sep 20, 2012
03:11 PM
I'm not sure I fully understand your problem, but do you mean you want the following, simpler, way:

Alan
Sep 20, 2012
03:21 PM
- Mark as New
- Bookmark
- Subscribe
- Mute
- Subscribe to RSS Feed
- Permalink
- Notify Moderator
Sep 20, 2012
03:21 PM
Just a couple of admin points ...
1. Pictures are good, but it's almost always better to post the worksheet as well (saves respondents the effort of retyping the worksheet plus it's not always obvious from an image what the problem may be (eg, whether what looks like an array index is actually a literal subscript).
2. You might be better off posting this as a Question rather than a blog, as respondents can't attach worksheets to your blog.
I'm don't know what you mean by "vectors and arrays which are actually scalars" as a scalar, by definition, cannot be either. Mathcad treats single column arrays as vectors, so if you're trying to simplify the calling of the vector, then whilst it is probably just as easy to enter a vector as a row (saves 'space' and looks neater), you can convert it to a column by applying the Transpose operator. You then only need use the one index.
You could just plot the vector v directly, but there's nothing wrong with what you've done.

As to the parentheses v brackets, most programming languages tend to use parentheses to enclose function arguments (Mathematica is an exception)
Stuart

