
Turn on suggestions
Auto-suggest helps you quickly narrow down your search results by suggesting possible matches as you type.
Showing results for
Turn on suggestions
Auto-suggest helps you quickly narrow down your search results by suggesting possible matches as you type.
Showing results for
Community Tip - Your Friends List is a way to easily have access to the community members that you interact with the most! X
Options
- Subscribe to RSS Feed
- Mark Topic as New
- Mark Topic as Read
- Float this Topic for Current User
- Bookmark
- Subscribe
- Mute
- Printer Friendly Page
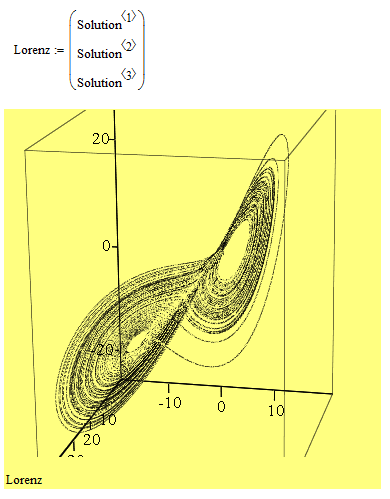
Mathcad 15 3D scatter plot from array of data
Nov 03, 2013
04:09 PM
- Mark as New
- Bookmark
- Subscribe
- Mute
- Subscribe to RSS Feed
- Permalink
- Notify Moderator
Nov 03, 2013
04:09 PM
Mathcad 15 3D scatter plot from array of data
Hi all,
I am new to the forum, so I want to apologize If I did something wrong in posting the question in a wrong place.
I have an issue in creating a scatter plot in Mathcad 15 with an array of data. I get an error message: "This value must be an integer" in the "CreateSpace".
Can you please have a look at my Mathcad worksheet and see what am I doing wrong?
Thank you in advance for your help.
Rafal
Solved! Go to Solution.
1 ACCEPTED SOLUTION
Accepted Solutions
Nov 03, 2013
05:03 PM
- Mark as New
- Bookmark
- Subscribe
- Mute
- Subscribe to RSS Feed
- Permalink
- Notify Moderator
Nov 03, 2013
05:03 PM
You created functions XX(j) etc. to be ble to use CreateSpace. But these functions are only valid for integer arguments in the range of 0 to rows(Solution)-1. The 3D-plot would try to evaluate these functions with non-integers arguments, too and so the error is thrown.
You could solve this problem by creating the functions using one of the interpolation functions Mathcad offers, but this would not be necessary.
All CreateSpace does is creating three vectors for the x-, y- and z-coordinates of the points to plot and nest them in a single vector.
You already have those xyz-vectors, so all you have to do is collect them in a vector and plot.
You may also be interested in
http://communities.ptc.com/docs/DOC-1155
http://communities.ptc.com/videos/1109
3 REPLIES 3
Nov 03, 2013
05:03 PM
- Mark as New
- Bookmark
- Subscribe
- Mute
- Subscribe to RSS Feed
- Permalink
- Notify Moderator
Nov 03, 2013
05:03 PM
You created functions XX(j) etc. to be ble to use CreateSpace. But these functions are only valid for integer arguments in the range of 0 to rows(Solution)-1. The 3D-plot would try to evaluate these functions with non-integers arguments, too and so the error is thrown.
You could solve this problem by creating the functions using one of the interpolation functions Mathcad offers, but this would not be necessary.
All CreateSpace does is creating three vectors for the x-, y- and z-coordinates of the points to plot and nest them in a single vector.
You already have those xyz-vectors, so all you have to do is collect them in a vector and plot.
You may also be interested in
http://communities.ptc.com/docs/DOC-1155
http://communities.ptc.com/videos/1109
Nov 03, 2013
05:35 PM
- Mark as New
- Bookmark
- Subscribe
- Mute
- Subscribe to RSS Feed
- Permalink
- Notify Moderator
Nov 03, 2013
05:35 PM
Thank you for your help in solving this issue Werner. Indeed, the solution works. I found it strange that the error appeared in this form, but your explanation that the 3D plot tried to evaluate those functions with non-integers arguments makes sense.
Best regards
Rafal
Nov 03, 2013
05:50 PM
- Mark as New
- Bookmark
- Subscribe
- Mute
- Subscribe to RSS Feed
- Permalink
- Notify Moderator
Nov 03, 2013
05:50 PM
You can right click the red character(s) the error is shown at and chose Trace Error - in your case this will bring you to the vector index j in XX[j.
You called CreateSpace with parameters 0, 100.
This would mean that j would run just from 0 to 100 (rather than the full length to 10^5). Furthermore you omitted the last grid parameter, which means that Createspace uses the default value 20. So it tries to create a vector with 20 elements. The first j-value would be 0, but the next is 100/19, a non-integer, throwing the error.
You could have uses CreateSpace(curve,0,100,21) without getting the error, but the plot would consist of 21 points only.
You get the full plot with CreateSpace(curve,0,100000,100001), but I think it does not make much sense, turning vectors into functions just to use CreateSpace to make vectors again 😉

