
Turn on suggestions
Auto-suggest helps you quickly narrow down your search results by suggesting possible matches as you type.
Showing results for
Turn on suggestions
Auto-suggest helps you quickly narrow down your search results by suggesting possible matches as you type.
Showing results for
Community Tip - Want the oppurtunity to discuss enhancements to PTC products? Join a working group! X
Options
- Subscribe to RSS Feed
- Mark Topic as New
- Mark Topic as Read
- Float this Topic for Current User
- Bookmark
- Subscribe
- Mute
- Printer Friendly Page
Mathcad's Bread and Butter
Feb 26, 2012
10:03 AM
- Mark as New
- Bookmark
- Subscribe
- Mute
- Subscribe to RSS Feed
- Permalink
- Notify Moderator
Feb 26, 2012
10:03 AM
Mathcad's Bread and Butter
I have contributed another worksheet on "Graphical Optimization of a Pipeline Design" that is the example for this month's blog. I consider this to be an example of Mathcad's bread and butter...calculating whatever you need that doesn't fit into the domain of specialized software.
The pipeline design problem came my way after I had switched from process development into pipeline modeling. At the time, my employer had licenses to a few pipeline simulation packages, but they lacked economic evaluation capability. My assignment was to determine the optimum design and cost of a long, gas transmission pipeline. The independent variables were all discrete: diameter, booster suction and pipeline outlet pressure, pipe grade, and number of booster stations. My past experience with optimization algorithms had me wary of discrete variable optimization. Since it looked like the number of cases was not excessive, I decided calculation of all cases and graphical examination of the results was a better option.
I won't go into the details of the model here. For those, see the document. Instead, I want to highlight some of the features of Mathcad that make it such a great program.
Interactive ease
I listed the four independent variables above. In the program, the number of booster stations is set at the start of the worksheet, then the cases for all of the other variables are computed and plotted. The graphs at the end of the worksheet can thus only show the optimum for the selected number of booster stations. But the program is very fast, so it is easy to reset the booster variable and recalculate. Likewise, the amount of fuel needed for compression along the pipeline is estimated, then manually updated after computing the worksheet. Using graphics, it only takes about a minute to find the optimum of 96 cases.
Quick plots to check work
Plots are so easy to make that I use them often just to check the intermediate calculations for accuracy and reasonable values. If I expect to see a smooth curve but I see something else, the work needs checking further. The solve block results in the example were checked in that manner...and it paid off. I needed to make a change in the buckling constraint.
Powerful solve block
I am still amazed at the capabilities of the nonlinear solve block algorithm in Mathcad. I've used it to get symbolic solutions of several equations and parametric numerical solutions. In the pipeline example, it obtained parametric functions, with the case index variables as the function arguments instead of normal variables. I wasn't sure that was going to work, but it worked great!
Problems are easy to develop
The pipeline program may look long, but it could be built and checked in small steps just by printing out the intermediate variables or functions. With Mathcad, the writing just seems to flow.
Almost self documenting
In the example, meaningful variable names were selected to aid in the documentation. The worksheet actually has less documentation than I often provide, but I think that most engineers should be able to follow the logic.
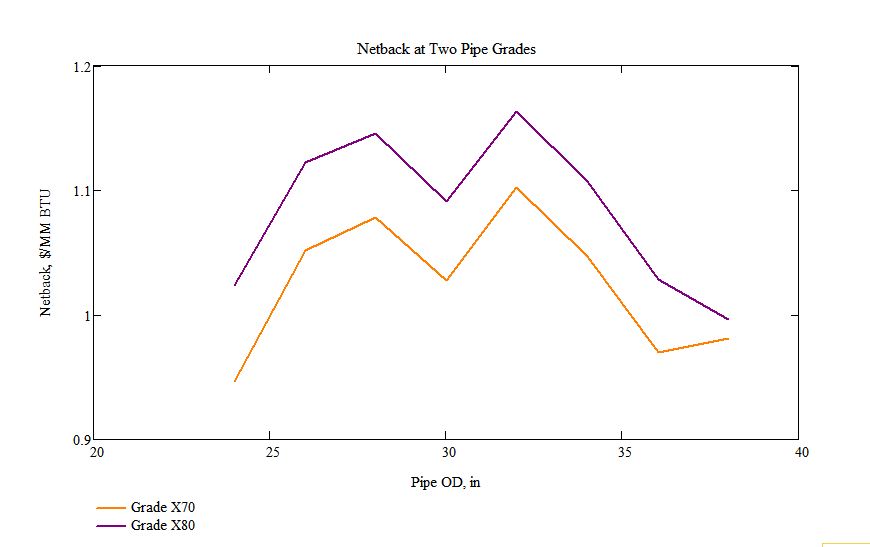
The Results
The plot below shows the final optimum at 32" diameter, grade X80 (see the document for other variable values) and one booster station. The local optimum at 28" could present a problem for an optimization algorithm depending upon the starting point. With the graphical approach used in the worksheet, the global optimum was found.
That's the bread and butter.
Next: Steak and Potatoes
Labels:
- Labels:
-
Statistics_Analysis
0 REPLIES 0

