Community Tip - If community subscription notifications are filling up your inbox you can set up a daily digest and get all your notifications in a single email. X
- Subscribe to RSS Feed
- Mark Topic as New
- Mark Topic as Read
- Float this Topic for Current User
- Bookmark
- Subscribe
- Mute
- Printer Friendly Page
Not able to plot complex function.
- Mark as New
- Bookmark
- Subscribe
- Mute
- Subscribe to RSS Feed
- Permalink
- Notify Moderator
Not able to plot complex function.
Hi,
I am trying to replicate an example I was given of plotting a bessel filter response. The example was completed with MathCad2.0 whilst I am using MathCad6 (if that matters).
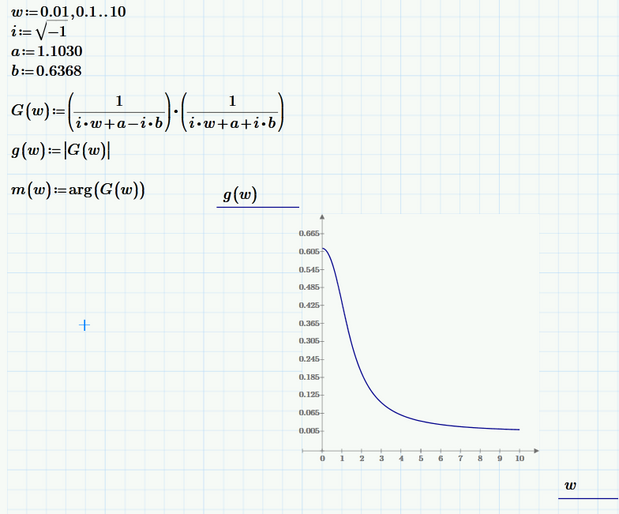
Everytime I try to plot the function I get an error saying "Plotting failed.Replace complex values and NaNs by real numbers".
Can you please advise what I am doing wrong, I thought by taking the absolute value of the function I wouldn't have any imaginary component?
I've attached the example and my worksheet for reference of the work.
Solved! Go to Solution.
- Labels:
-
Electrical_Engineering
Accepted Solutions
- Mark as New
- Bookmark
- Subscribe
- Mute
- Subscribe to RSS Feed
- Permalink
- Notify Moderator
There are two problems in your sheet:
1. The g in g(w) in your plot is a constant, instead of the g(w) that you defined next to the plot. Check its label, change it to variable, just as the g(w) in the definition.
2. The definition of g(w) is next to the plot. Prime works left to right, top to bottom. The entry point of the plot is at its top-left corner. This means that 'as far as the plot can see' g(w) is not (yet) defined.
If you move the plot to below all your definitions, it plots.
Note that instead of first defining g(w), you could also plot |G(w)| and arg(G(w)) directly. But be sure that the plot's top-left corner is at least below and/or to the right of the definition of G(w)...
Success!
Luc
- Mark as New
- Bookmark
- Subscribe
- Mute
- Subscribe to RSS Feed
- Permalink
- Notify Moderator
Thank you very much Luc!
That has resolved my issue.
- Mark as New
- Bookmark
- Subscribe
- Mute
- Subscribe to RSS Feed
- Permalink
- Notify Moderator
@BSmith123 wrote:
Hi,
I am trying to replicate an example I was given of plotting a bessel filter response. The example was completed with MathCad2.0 whilst I am using MathCad6 (if that matters).
Everytime I try to plot the function I get an error saying "Plotting failed.Replace complex values and NaNs by real numbers".
Can you please advise what I am doing wrong, I thought by taking the absolute value of the function I wouldn't have any imaginary component?
I've attached the example and my worksheet for reference of the work.
As Luc already wrote, Prime is reading your sheet from top to bottom and from left to right.
All you have to do to see your plot is moving the plot region further down so the top of the plot region is below the definition of g(w). Doing so also fixes the problem with the wrong label which Luc mentioned. Thanks to Primes auto-labeling feature g in g(w) gets the correct label automatically.
BTW, you don't need to define the imaginary unit yourself, its built in and you get it by typing 1i or 1j.
Unfortunately in Prime (in contrary to Mathcad) is also shows up that way which looks ugly and confusing. So this may be a good reason to define it yourself nonetheless. You may write i:=1i
- Mark as New
- Bookmark
- Subscribe
- Mute
- Subscribe to RSS Feed
- Permalink
- Notify Moderator
Thanks Werner_E,
I am very new with the software so appreciate the tips!
- Mark as New
- Bookmark
- Subscribe
- Mute
- Subscribe to RSS Feed
- Permalink
- Notify Moderator
And what about this:


